Immigrants from Nepal vs Cajun In Labor Force | Age 20-24
COMPARE
Immigrants from Nepal
Cajun
In Labor Force | Age 20-24
In Labor Force | Age 20-24 Comparison
Immigrants from Nepal
Cajuns
76.0%
IN LABOR FORCE | AGE 20-24
97.2/ 100
METRIC RATING
105th/ 347
METRIC RANK
75.1%
IN LABOR FORCE | AGE 20-24
51.1/ 100
METRIC RATING
171st/ 347
METRIC RANK
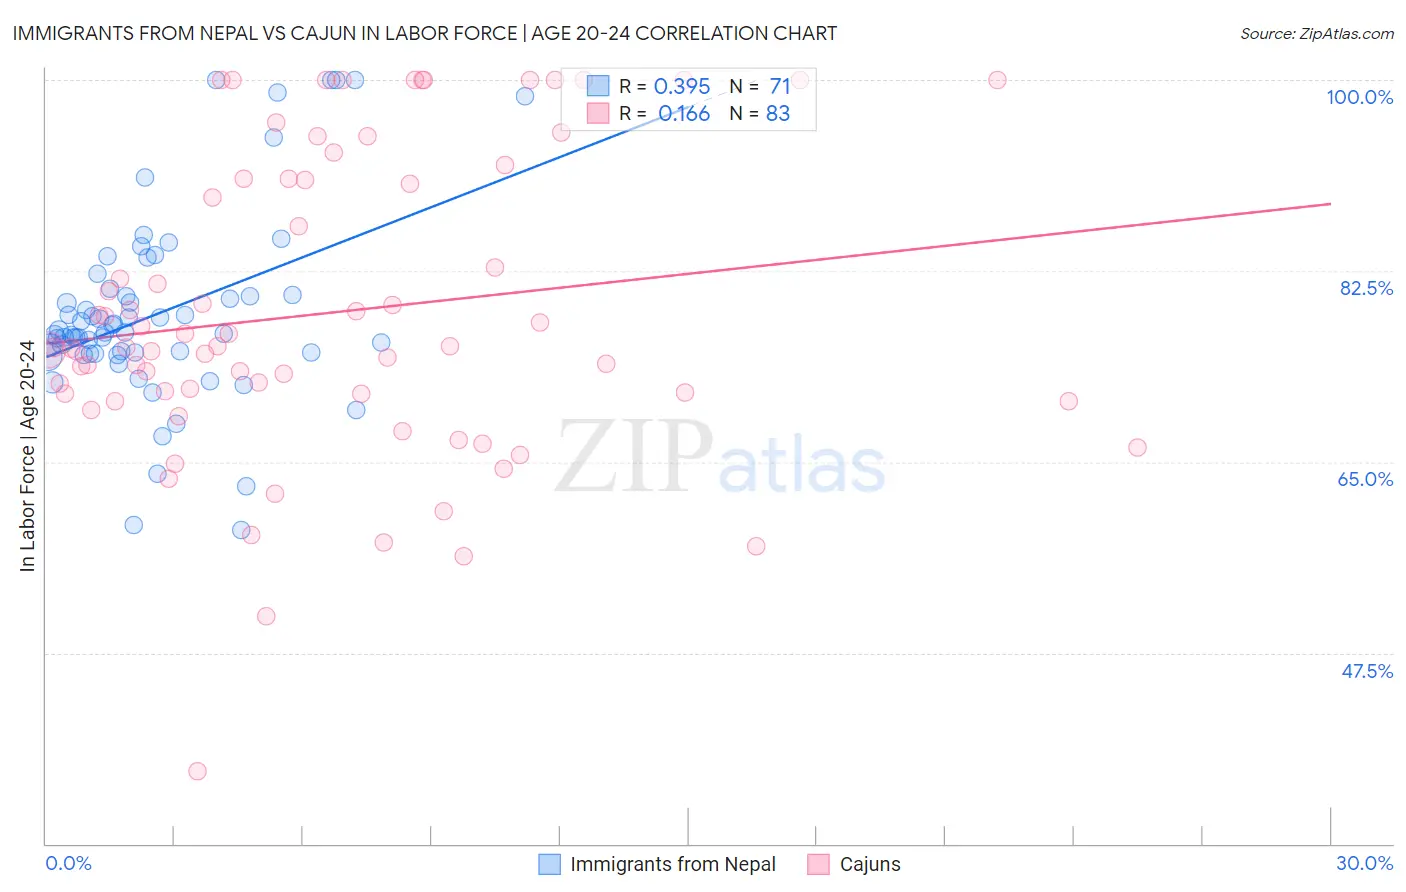
Immigrants from Nepal vs Cajun In Labor Force | Age 20-24 Correlation Chart
The statistical analysis conducted on geographies consisting of 186,788,747 people shows a mild positive correlation between the proportion of Immigrants from Nepal and labor force participation rate among population between the ages 20 and 24 in the United States with a correlation coefficient (R) of 0.395 and weighted average of 76.0%. Similarly, the statistical analysis conducted on geographies consisting of 149,676,462 people shows a poor positive correlation between the proportion of Cajuns and labor force participation rate among population between the ages 20 and 24 in the United States with a correlation coefficient (R) of 0.166 and weighted average of 75.1%, a difference of 1.3%.
In Labor Force | Age 20-24 Correlation Summary
| Measurement | Immigrants from Nepal | Cajun |
| Minimum | 58.7% | 36.6% |
| Maximum | 100.0% | 100.0% |
| Range | 41.3% | 63.4% |
| Mean | 78.6% | 78.7% |
| Median | 76.8% | 75.5% |
| Interquartile 25% (IQ1) | 74.9% | 71.2% |
| Interquartile 75% (IQ3) | 80.3% | 90.9% |
| Interquartile Range (IQR) | 5.4% | 19.7% |
| Standard Deviation (Sample) | 8.7% | 13.7% |
| Standard Deviation (Population) | 8.7% | 13.7% |
Similar Demographics by In Labor Force | Age 20-24
Demographics Similar to Immigrants from Nepal by In Labor Force | Age 20-24
In terms of in labor force | age 20-24, the demographic groups most similar to Immigrants from Nepal are Macedonian (76.0%, a difference of 0.0%), Immigrants from Uganda (76.0%, a difference of 0.010%), Immigrants from North Macedonia (76.1%, a difference of 0.040%), Greek (76.0%, a difference of 0.040%), and Latvian (76.1%, a difference of 0.060%).
| Demographics | Rating | Rank | In Labor Force | Age 20-24 |
| Immigrants | Oceania | 98.0 /100 | #98 | Exceptional 76.1% |
| Americans | 97.8 /100 | #99 | Exceptional 76.1% |
| Shoshone | 97.8 /100 | #100 | Exceptional 76.1% |
| Immigrants | Poland | 97.7 /100 | #101 | Exceptional 76.1% |
| Latvians | 97.6 /100 | #102 | Exceptional 76.1% |
| Immigrants | North Macedonia | 97.5 /100 | #103 | Exceptional 76.1% |
| Macedonians | 97.2 /100 | #104 | Exceptional 76.0% |
| Immigrants | Nepal | 97.2 /100 | #105 | Exceptional 76.0% |
| Immigrants | Uganda | 97.1 /100 | #106 | Exceptional 76.0% |
| Greeks | 96.9 /100 | #107 | Exceptional 76.0% |
| Iraqis | 96.6 /100 | #108 | Exceptional 76.0% |
| Cherokee | 95.8 /100 | #109 | Exceptional 75.9% |
| Immigrants | Morocco | 95.8 /100 | #110 | Exceptional 75.9% |
| Ukrainians | 95.7 /100 | #111 | Exceptional 75.9% |
| Immigrants | Canada | 95.6 /100 | #112 | Exceptional 75.9% |
Demographics Similar to Cajuns by In Labor Force | Age 20-24
In terms of in labor force | age 20-24, the demographic groups most similar to Cajuns are Mexican (75.1%, a difference of 0.010%), Yakama (75.1%, a difference of 0.010%), Immigrants from Croatia (75.1%, a difference of 0.010%), South African (75.0%, a difference of 0.020%), and Syrian (75.0%, a difference of 0.020%).
| Demographics | Rating | Rank | In Labor Force | Age 20-24 |
| Bolivians | 64.0 /100 | #164 | Good 75.2% |
| Afghans | 63.5 /100 | #165 | Good 75.2% |
| Cambodians | 60.5 /100 | #166 | Good 75.2% |
| Immigrants | South Eastern Asia | 57.5 /100 | #167 | Average 75.1% |
| Immigrants | Western Africa | 56.7 /100 | #168 | Average 75.1% |
| Immigrants | Philippines | 55.8 /100 | #169 | Average 75.1% |
| Mexicans | 52.1 /100 | #170 | Average 75.1% |
| Cajuns | 51.1 /100 | #171 | Average 75.1% |
| Yakama | 50.8 /100 | #172 | Average 75.1% |
| Immigrants | Croatia | 50.2 /100 | #173 | Average 75.1% |
| South Africans | 50.0 /100 | #174 | Average 75.0% |
| Syrians | 49.5 /100 | #175 | Average 75.0% |
| Central Americans | 48.7 /100 | #176 | Average 75.0% |
| Immigrants | Mexico | 47.8 /100 | #177 | Average 75.0% |
| Immigrants | Central America | 45.0 /100 | #178 | Average 75.0% |