Immigrants from Hungary vs Immigrants from Syria In Labor Force | Age 16-19
COMPARE
Immigrants from Hungary
Immigrants from Syria
In Labor Force | Age 16-19
In Labor Force | Age 16-19 Comparison
Immigrants from Hungary
Immigrants from Syria
36.2%
IN LABOR FORCE | AGE 16-19
28.8/ 100
METRIC RATING
189th/ 347
METRIC RANK
35.2%
IN LABOR FORCE | AGE 16-19
4.5/ 100
METRIC RATING
231st/ 347
METRIC RANK
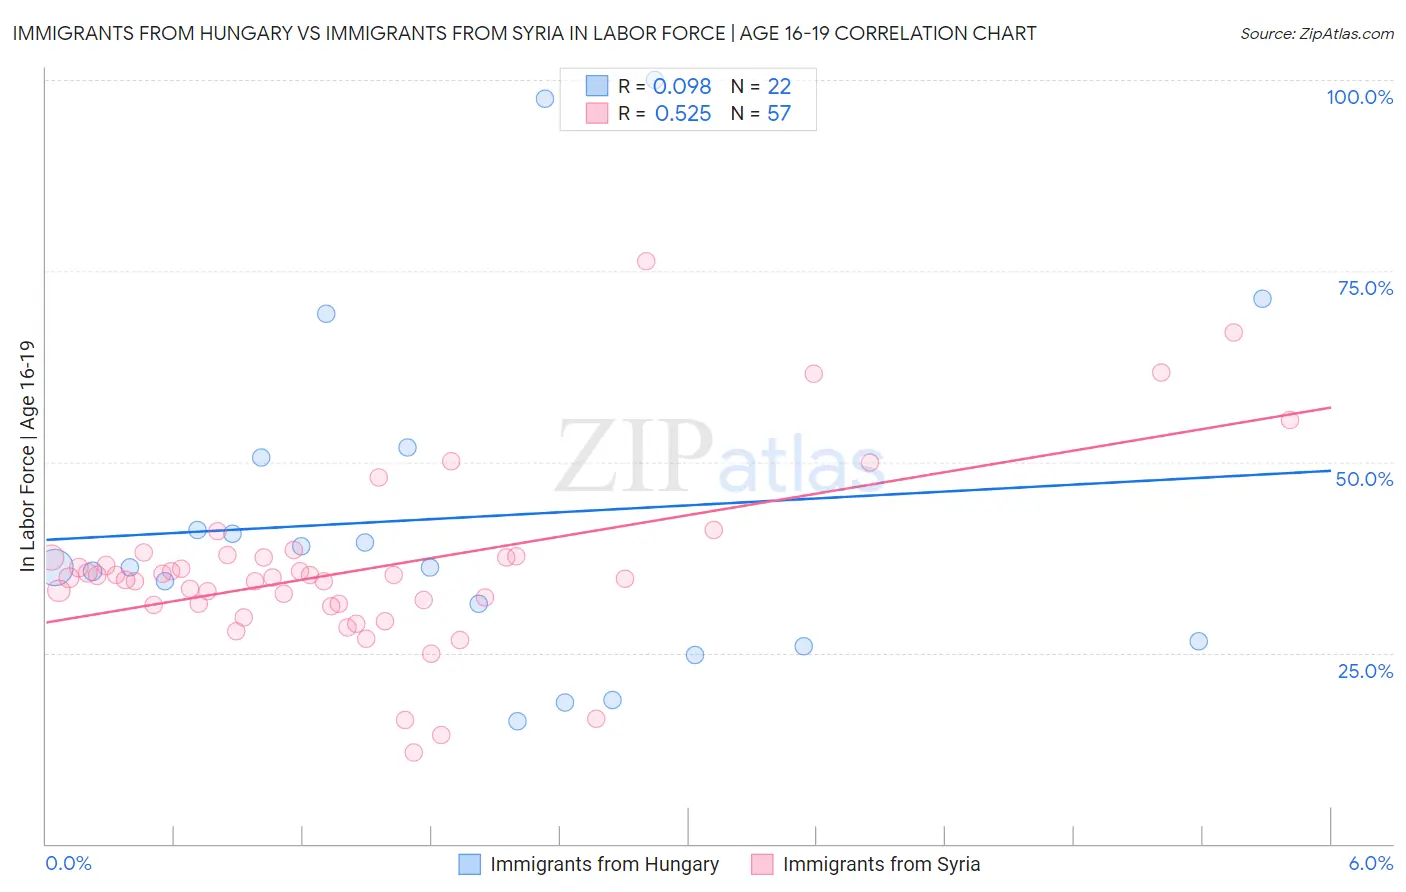
Immigrants from Hungary vs Immigrants from Syria In Labor Force | Age 16-19 Correlation Chart
The statistical analysis conducted on geographies consisting of 195,472,897 people shows a slight positive correlation between the proportion of Immigrants from Hungary and labor force participation rate among population between the ages 16 and 19 in the United States with a correlation coefficient (R) of 0.098 and weighted average of 36.2%. Similarly, the statistical analysis conducted on geographies consisting of 174,056,881 people shows a substantial positive correlation between the proportion of Immigrants from Syria and labor force participation rate among population between the ages 16 and 19 in the United States with a correlation coefficient (R) of 0.525 and weighted average of 35.2%, a difference of 2.8%.
In Labor Force | Age 16-19 Correlation Summary
| Measurement | Immigrants from Hungary | Immigrants from Syria |
| Minimum | 16.1% | 12.0% |
| Maximum | 100.0% | 76.3% |
| Range | 83.9% | 64.3% |
| Mean | 42.8% | 36.0% |
| Median | 36.2% | 34.9% |
| Interquartile 25% (IQ1) | 26.5% | 31.3% |
| Interquartile 75% (IQ3) | 50.5% | 37.5% |
| Interquartile Range (IQR) | 24.0% | 6.2% |
| Standard Deviation (Sample) | 23.0% | 11.5% |
| Standard Deviation (Population) | 22.5% | 11.4% |
Similar Demographics by In Labor Force | Age 16-19
Demographics Similar to Immigrants from Hungary by In Labor Force | Age 16-19
In terms of in labor force | age 16-19, the demographic groups most similar to Immigrants from Hungary are Panamanian (36.1%, a difference of 0.010%), Immigrants from Croatia (36.1%, a difference of 0.080%), Immigrants from Europe (36.2%, a difference of 0.18%), Afghan (36.1%, a difference of 0.20%), and Immigrants from Denmark (36.1%, a difference of 0.25%).
| Demographics | Rating | Rank | In Labor Force | Age 16-19 |
| Immigrants | Italy | 39.1 /100 | #182 | Fair 36.4% |
| Eastern Europeans | 38.8 /100 | #183 | Fair 36.4% |
| Costa Ricans | 36.1 /100 | #184 | Fair 36.3% |
| Bhutanese | 35.3 /100 | #185 | Fair 36.3% |
| Immigrants | Romania | 34.0 /100 | #186 | Fair 36.3% |
| Immigrants | Afghanistan | 34.0 /100 | #187 | Fair 36.3% |
| Immigrants | Europe | 31.8 /100 | #188 | Fair 36.2% |
| Immigrants | Hungary | 28.8 /100 | #189 | Fair 36.2% |
| Panamanians | 28.6 /100 | #190 | Fair 36.1% |
| Immigrants | Croatia | 27.5 /100 | #191 | Fair 36.1% |
| Afghans | 25.7 /100 | #192 | Fair 36.1% |
| Immigrants | Denmark | 25.0 /100 | #193 | Fair 36.1% |
| Nigerians | 24.6 /100 | #194 | Fair 36.1% |
| Bolivians | 23.3 /100 | #195 | Fair 36.0% |
| Mexican American Indians | 21.1 /100 | #196 | Fair 36.0% |
Demographics Similar to Immigrants from Syria by In Labor Force | Age 16-19
In terms of in labor force | age 16-19, the demographic groups most similar to Immigrants from Syria are Immigrants from Kazakhstan (35.2%, a difference of 0.0%), Immigrants from France (35.1%, a difference of 0.040%), Immigrants from Mexico (35.1%, a difference of 0.080%), Immigrants from Honduras (35.2%, a difference of 0.12%), and Immigrants from Lebanon (35.2%, a difference of 0.15%).
| Demographics | Rating | Rank | In Labor Force | Age 16-19 |
| Hondurans | 6.5 /100 | #224 | Tragic 35.3% |
| Immigrants | Belgium | 6.1 /100 | #225 | Tragic 35.3% |
| Immigrants | Guatemala | 5.7 /100 | #226 | Tragic 35.3% |
| Mongolians | 5.7 /100 | #227 | Tragic 35.3% |
| Immigrants | Senegal | 5.5 /100 | #228 | Tragic 35.3% |
| Immigrants | Lebanon | 5.0 /100 | #229 | Tragic 35.2% |
| Immigrants | Honduras | 4.9 /100 | #230 | Tragic 35.2% |
| Immigrants | Syria | 4.5 /100 | #231 | Tragic 35.2% |
| Immigrants | Kazakhstan | 4.5 /100 | #232 | Tragic 35.2% |
| Immigrants | France | 4.3 /100 | #233 | Tragic 35.1% |
| Immigrants | Mexico | 4.2 /100 | #234 | Tragic 35.1% |
| Immigrants | Philippines | 4.0 /100 | #235 | Tragic 35.1% |
| Immigrants | Australia | 3.6 /100 | #236 | Tragic 35.1% |
| Immigrants | India | 3.5 /100 | #237 | Tragic 35.0% |
| Immigrants | Vietnam | 3.4 /100 | #238 | Tragic 35.0% |