British vs Sudanese In Labor Force | Age > 16
COMPARE
British
Sudanese
In Labor Force | Age > 16
In Labor Force | Age > 16 Comparison
British
Sudanese
64.7%
IN LABOR FORCE | AGE > 16
7.3/ 100
METRIC RATING
229th/ 347
METRIC RANK
68.0%
IN LABOR FORCE | AGE > 16
100.0/ 100
METRIC RATING
12th/ 347
METRIC RANK
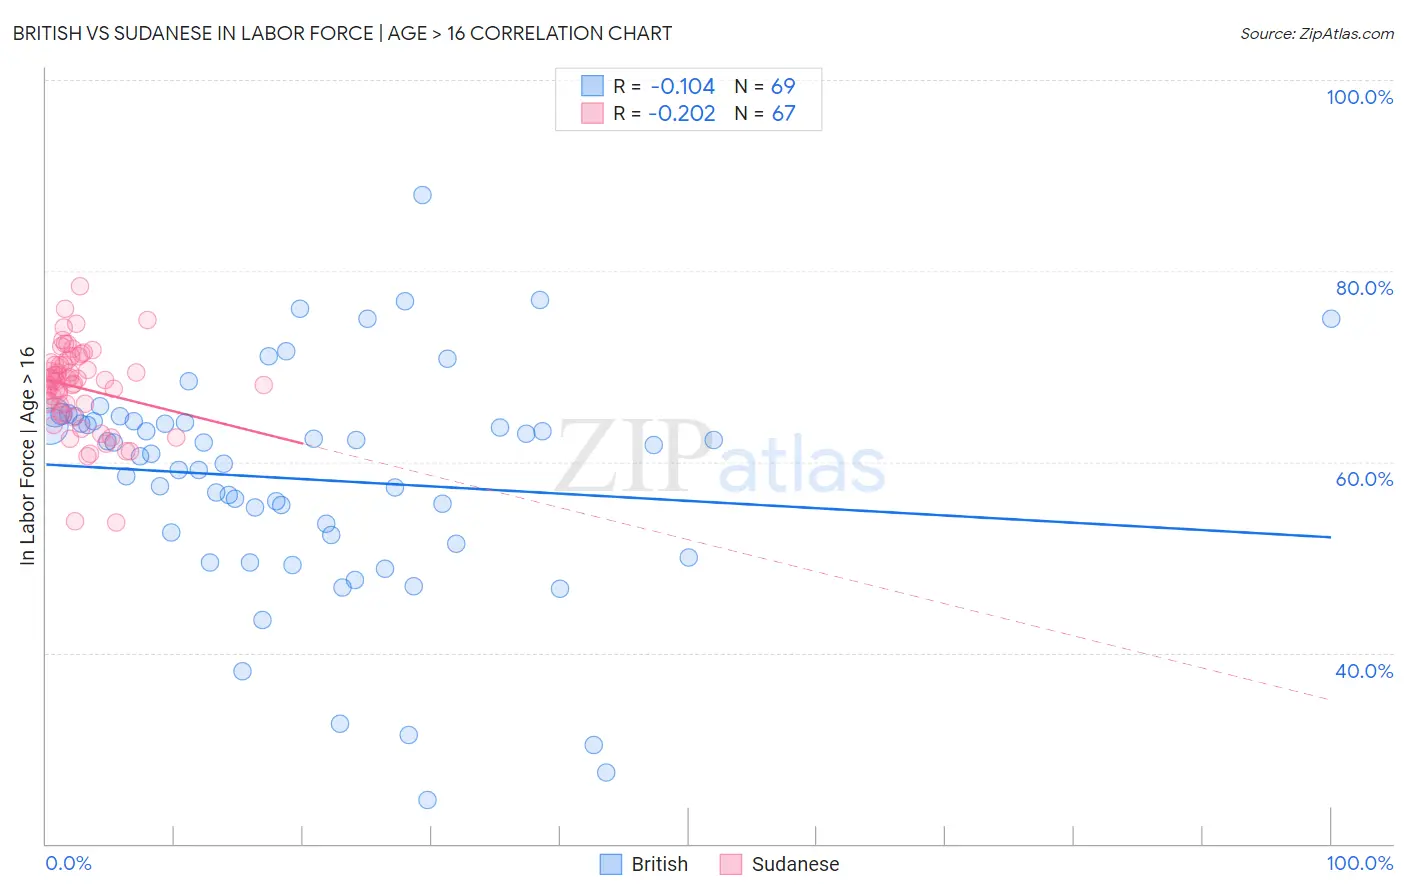
British vs Sudanese In Labor Force | Age > 16 Correlation Chart
The statistical analysis conducted on geographies consisting of 531,501,445 people shows a poor negative correlation between the proportion of British and labor force participation rate among population ages 16 and over in the United States with a correlation coefficient (R) of -0.104 and weighted average of 64.7%. Similarly, the statistical analysis conducted on geographies consisting of 110,150,876 people shows a weak negative correlation between the proportion of Sudanese and labor force participation rate among population ages 16 and over in the United States with a correlation coefficient (R) of -0.202 and weighted average of 68.0%, a difference of 5.2%.
In Labor Force | Age > 16 Correlation Summary
| Measurement | British | Sudanese |
| Minimum | 24.6% | 53.6% |
| Maximum | 87.9% | 78.4% |
| Range | 63.3% | 24.8% |
| Mean | 58.2% | 67.8% |
| Median | 60.9% | 68.5% |
| Interquartile 25% (IQ1) | 51.9% | 65.9% |
| Interquartile 75% (IQ3) | 64.3% | 70.4% |
| Interquartile Range (IQR) | 12.5% | 4.5% |
| Standard Deviation (Sample) | 12.0% | 4.5% |
| Standard Deviation (Population) | 11.9% | 4.5% |
Similar Demographics by In Labor Force | Age > 16
Demographics Similar to British by In Labor Force | Age > 16
In terms of in labor force | age > 16, the demographic groups most similar to British are Chinese (64.7%, a difference of 0.0%), Immigrants from Northern Europe (64.7%, a difference of 0.0%), European (64.7%, a difference of 0.040%), Polish (64.7%, a difference of 0.040%), and Northern European (64.7%, a difference of 0.040%).
| Demographics | Rating | Rank | In Labor Force | Age > 16 |
| Hawaiians | 9.3 /100 | #222 | Tragic 64.7% |
| Immigrants | Belize | 9.2 /100 | #223 | Tragic 64.7% |
| Immigrants | Jamaica | 8.8 /100 | #224 | Tragic 64.7% |
| Croatians | 8.8 /100 | #225 | Tragic 64.7% |
| Europeans | 8.3 /100 | #226 | Tragic 64.7% |
| Poles | 8.3 /100 | #227 | Tragic 64.7% |
| Northern Europeans | 8.2 /100 | #228 | Tragic 64.7% |
| British | 7.3 /100 | #229 | Tragic 64.7% |
| Chinese | 7.3 /100 | #230 | Tragic 64.7% |
| Immigrants | Northern Europe | 7.2 /100 | #231 | Tragic 64.7% |
| Africans | 5.8 /100 | #232 | Tragic 64.6% |
| Slavs | 4.9 /100 | #233 | Tragic 64.6% |
| Vietnamese | 4.7 /100 | #234 | Tragic 64.6% |
| Austrians | 4.6 /100 | #235 | Tragic 64.6% |
| Immigrants | Norway | 4.6 /100 | #236 | Tragic 64.6% |
Demographics Similar to Sudanese by In Labor Force | Age > 16
In terms of in labor force | age > 16, the demographic groups most similar to Sudanese are Immigrants from Nepal (68.0%, a difference of 0.020%), Bolivian (68.2%, a difference of 0.22%), Liberian (67.8%, a difference of 0.38%), Immigrants from Middle Africa (67.7%, a difference of 0.44%), and Immigrants from Sudan (67.7%, a difference of 0.54%).
| Demographics | Rating | Rank | In Labor Force | Age > 16 |
| Sierra Leoneans | 100.0 /100 | #5 | Exceptional 68.9% |
| Immigrants | Eritrea | 100.0 /100 | #6 | Exceptional 68.9% |
| Immigrants | Cameroon | 100.0 /100 | #7 | Exceptional 68.7% |
| Immigrants | Sierra Leone | 100.0 /100 | #8 | Exceptional 68.5% |
| Immigrants | Eastern Africa | 100.0 /100 | #9 | Exceptional 68.5% |
| Immigrants | Bolivia | 100.0 /100 | #10 | Exceptional 68.4% |
| Bolivians | 100.0 /100 | #11 | Exceptional 68.2% |
| Sudanese | 100.0 /100 | #12 | Exceptional 68.0% |
| Immigrants | Nepal | 100.0 /100 | #13 | Exceptional 68.0% |
| Liberians | 100.0 /100 | #14 | Exceptional 67.8% |
| Immigrants | Middle Africa | 100.0 /100 | #15 | Exceptional 67.7% |
| Immigrants | Sudan | 100.0 /100 | #16 | Exceptional 67.7% |
| Immigrants | India | 100.0 /100 | #17 | Exceptional 67.6% |
| Immigrants | Liberia | 100.0 /100 | #18 | Exceptional 67.6% |
| Kenyans | 100.0 /100 | #19 | Exceptional 67.6% |