Brazilian vs Immigrants from Sudan In Labor Force | Age 35-44
COMPARE
Brazilian
Immigrants from Sudan
In Labor Force | Age 35-44
In Labor Force | Age 35-44 Comparison
Brazilians
Immigrants from Sudan
85.0%
IN LABOR FORCE | AGE 35-44
99.0/ 100
METRIC RATING
70th/ 347
METRIC RANK
84.9%
IN LABOR FORCE | AGE 35-44
98.1/ 100
METRIC RATING
82nd/ 347
METRIC RANK
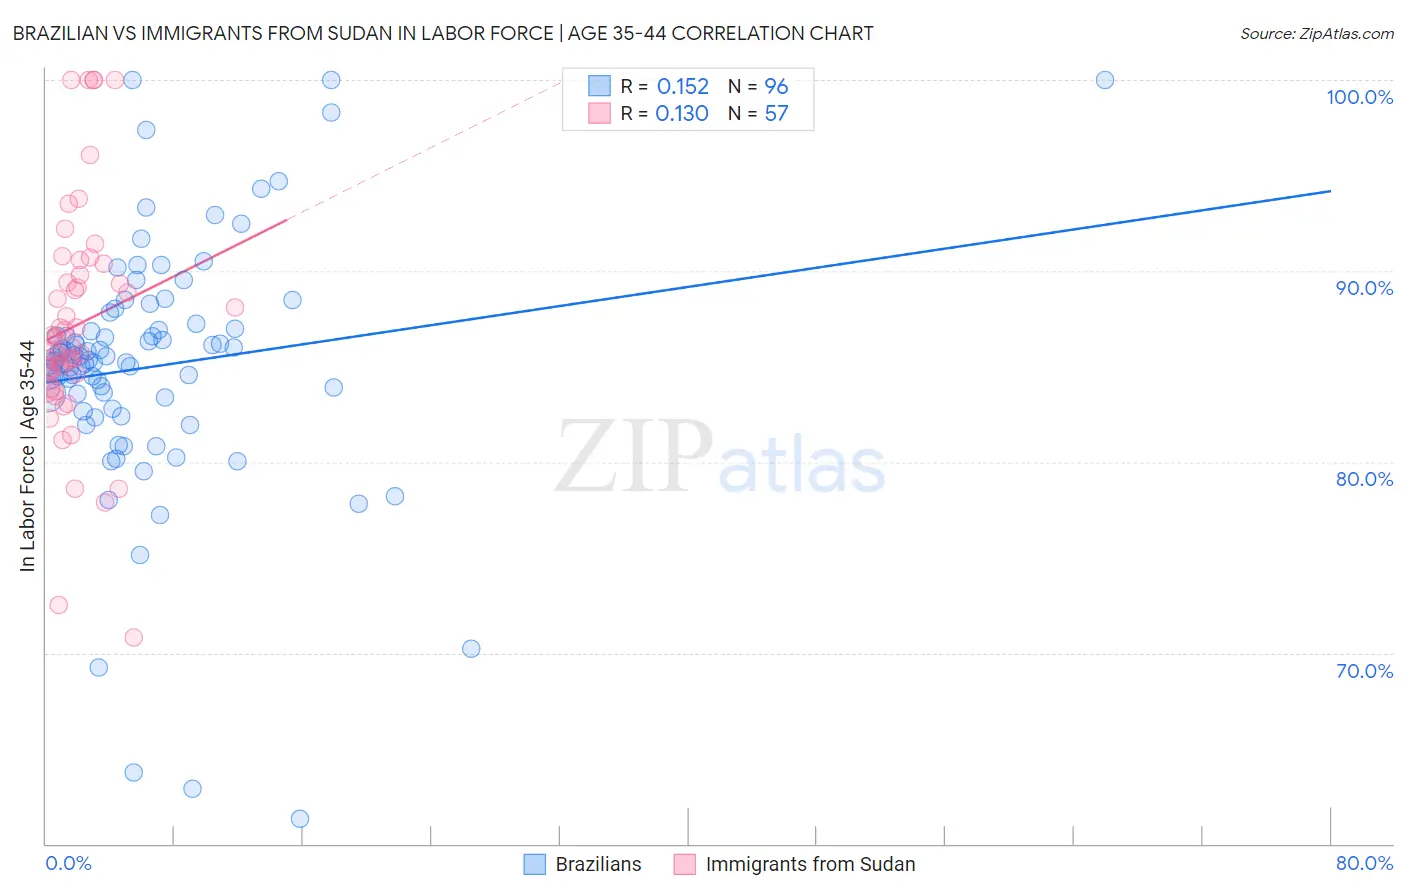
Brazilian vs Immigrants from Sudan In Labor Force | Age 35-44 Correlation Chart
The statistical analysis conducted on geographies consisting of 323,788,693 people shows a poor positive correlation between the proportion of Brazilians and labor force participation rate among population between the ages 35 and 44 in the United States with a correlation coefficient (R) of 0.152 and weighted average of 85.0%. Similarly, the statistical analysis conducted on geographies consisting of 118,957,461 people shows a poor positive correlation between the proportion of Immigrants from Sudan and labor force participation rate among population between the ages 35 and 44 in the United States with a correlation coefficient (R) of 0.130 and weighted average of 84.9%, a difference of 0.11%.
In Labor Force | Age 35-44 Correlation Summary
| Measurement | Brazilian | Immigrants from Sudan |
| Minimum | 61.3% | 70.8% |
| Maximum | 100.0% | 100.0% |
| Range | 38.7% | 29.2% |
| Mean | 85.0% | 87.2% |
| Median | 85.4% | 86.5% |
| Interquartile 25% (IQ1) | 83.1% | 84.2% |
| Interquartile 75% (IQ3) | 87.1% | 90.1% |
| Interquartile Range (IQR) | 4.0% | 5.8% |
| Standard Deviation (Sample) | 6.6% | 6.1% |
| Standard Deviation (Population) | 6.6% | 6.0% |
Demographics Similar to Brazilians and Immigrants from Sudan by In Labor Force | Age 35-44
In terms of in labor force | age 35-44, the demographic groups most similar to Brazilians are Sudanese (85.0%, a difference of 0.0%), Russian (85.0%, a difference of 0.0%), Italian (85.0%, a difference of 0.010%), Immigrants from Haiti (85.0%, a difference of 0.020%), and Immigrants from Italy (85.0%, a difference of 0.020%). Similarly, the demographic groups most similar to Immigrants from Sudan are Peruvian (84.9%, a difference of 0.020%), Immigrants from Colombia (84.9%, a difference of 0.020%), Immigrants from Eastern Europe (84.9%, a difference of 0.020%), Senegalese (84.9%, a difference of 0.020%), and Immigrants from Peru (84.9%, a difference of 0.020%).
| Demographics | Rating | Rank | In Labor Force | Age 35-44 |
| Immigrants | Haiti | 99.1 /100 | #66 | Exceptional 85.0% |
| Immigrants | Italy | 99.1 /100 | #67 | Exceptional 85.0% |
| Italians | 99.1 /100 | #68 | Exceptional 85.0% |
| Sudanese | 99.0 /100 | #69 | Exceptional 85.0% |
| Brazilians | 99.0 /100 | #70 | Exceptional 85.0% |
| Russians | 99.0 /100 | #71 | Exceptional 85.0% |
| Immigrants | Singapore | 98.9 /100 | #72 | Exceptional 85.0% |
| Immigrants | Sri Lanka | 98.9 /100 | #73 | Exceptional 85.0% |
| Colombians | 98.8 /100 | #74 | Exceptional 85.0% |
| Immigrants | South Central Asia | 98.7 /100 | #75 | Exceptional 85.0% |
| Immigrants | Cuba | 98.6 /100 | #76 | Exceptional 84.9% |
| Immigrants | Turkey | 98.6 /100 | #77 | Exceptional 84.9% |
| Immigrants | Africa | 98.4 /100 | #78 | Exceptional 84.9% |
| Peruvians | 98.3 /100 | #79 | Exceptional 84.9% |
| Immigrants | Colombia | 98.3 /100 | #80 | Exceptional 84.9% |
| Immigrants | Eastern Europe | 98.3 /100 | #81 | Exceptional 84.9% |
| Immigrants | Sudan | 98.1 /100 | #82 | Exceptional 84.9% |
| Senegalese | 97.8 /100 | #83 | Exceptional 84.9% |
| Immigrants | Peru | 97.8 /100 | #84 | Exceptional 84.9% |
| Immigrants | Middle Africa | 97.8 /100 | #85 | Exceptional 84.9% |
| Greeks | 97.8 /100 | #86 | Exceptional 84.9% |