Immigrants from Latvia vs Spanish American In Labor Force | Age 20-64
COMPARE
Immigrants from Latvia
Spanish American
In Labor Force | Age 20-64
In Labor Force | Age 20-64 Comparison
Immigrants from Latvia
Spanish Americans
80.1%
IN LABOR FORCE | AGE 20-64
97.2/ 100
METRIC RATING
84th/ 347
METRIC RANK
77.8%
IN LABOR FORCE | AGE 20-64
0.0/ 100
METRIC RATING
291st/ 347
METRIC RANK
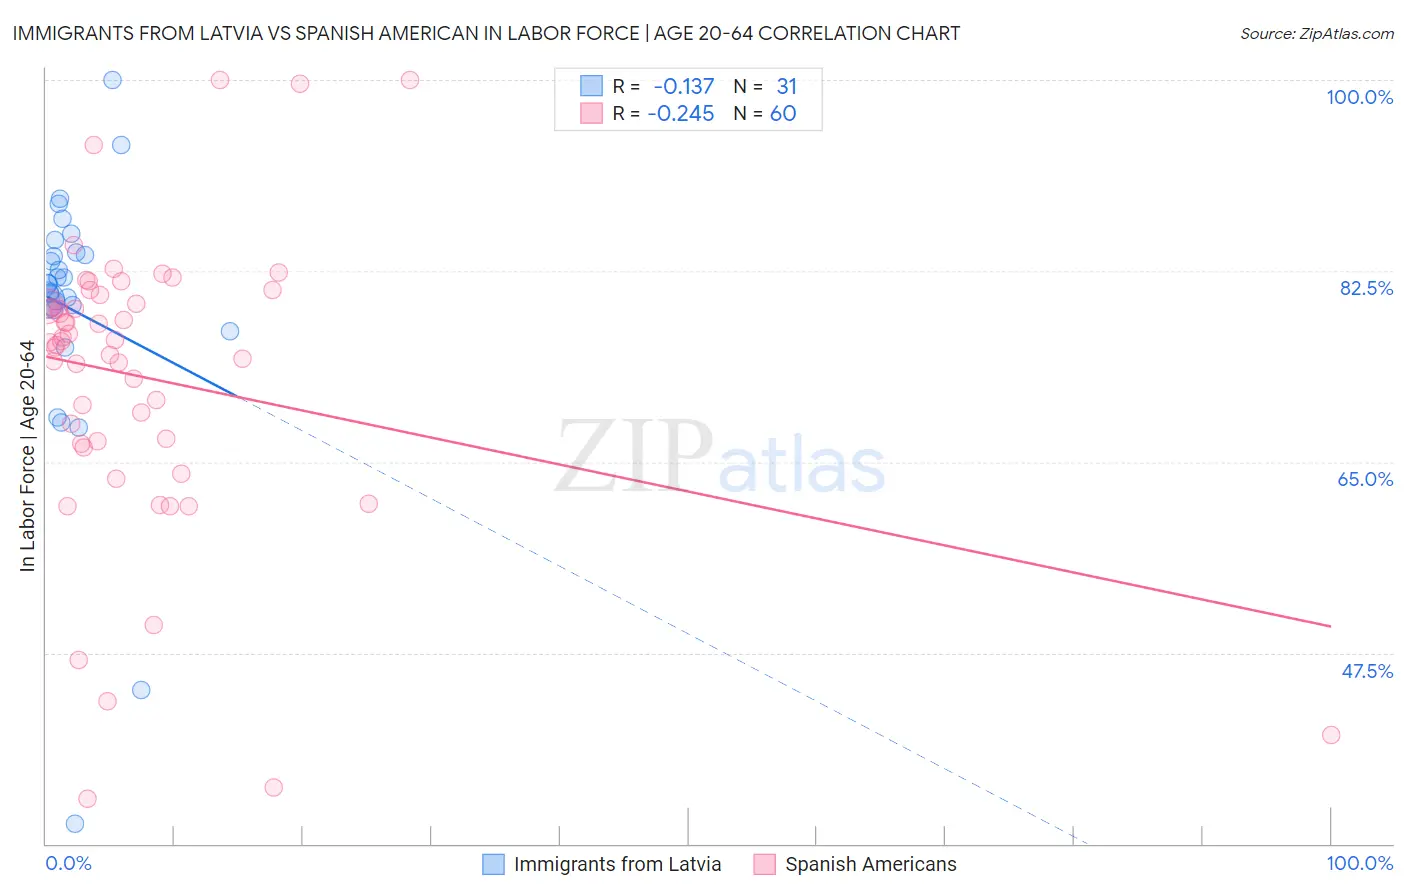
Immigrants from Latvia vs Spanish American In Labor Force | Age 20-64 Correlation Chart
The statistical analysis conducted on geographies consisting of 113,735,345 people shows a poor negative correlation between the proportion of Immigrants from Latvia and labor force participation rate among population between the ages 20 and 64 in the United States with a correlation coefficient (R) of -0.137 and weighted average of 80.1%. Similarly, the statistical analysis conducted on geographies consisting of 103,168,407 people shows a weak negative correlation between the proportion of Spanish Americans and labor force participation rate among population between the ages 20 and 64 in the United States with a correlation coefficient (R) of -0.245 and weighted average of 77.8%, a difference of 2.9%.
In Labor Force | Age 20-64 Correlation Summary
| Measurement | Immigrants from Latvia | Spanish American |
| Minimum | 31.8% | 34.1% |
| Maximum | 100.0% | 100.0% |
| Range | 68.2% | 65.9% |
| Mean | 78.9% | 72.7% |
| Median | 81.3% | 76.0% |
| Interquartile 25% (IQ1) | 78.9% | 66.8% |
| Interquartile 75% (IQ3) | 84.2% | 79.9% |
| Interquartile Range (IQR) | 5.3% | 13.1% |
| Standard Deviation (Sample) | 12.8% | 13.8% |
| Standard Deviation (Population) | 12.6% | 13.6% |
Similar Demographics by In Labor Force | Age 20-64
Demographics Similar to Immigrants from Latvia by In Labor Force | Age 20-64
In terms of in labor force | age 20-64, the demographic groups most similar to Immigrants from Latvia are Colombian (80.1%, a difference of 0.0%), German Russian (80.1%, a difference of 0.010%), Immigrants from Japan (80.1%, a difference of 0.010%), Jordanian (80.1%, a difference of 0.010%), and Immigrants from Egypt (80.1%, a difference of 0.010%).
| Demographics | Rating | Rank | In Labor Force | Age 20-64 |
| Immigrants | Colombia | 97.8 /100 | #77 | Exceptional 80.2% |
| Immigrants | Romania | 97.8 /100 | #78 | Exceptional 80.2% |
| Asians | 97.7 /100 | #79 | Exceptional 80.2% |
| Immigrants | Croatia | 97.6 /100 | #80 | Exceptional 80.1% |
| German Russians | 97.3 /100 | #81 | Exceptional 80.1% |
| Immigrants | Japan | 97.3 /100 | #82 | Exceptional 80.1% |
| Colombians | 97.3 /100 | #83 | Exceptional 80.1% |
| Immigrants | Latvia | 97.2 /100 | #84 | Exceptional 80.1% |
| Jordanians | 97.2 /100 | #85 | Exceptional 80.1% |
| Immigrants | Egypt | 97.1 /100 | #86 | Exceptional 80.1% |
| Croatians | 97.1 /100 | #87 | Exceptional 80.1% |
| Chileans | 97.0 /100 | #88 | Exceptional 80.1% |
| Immigrants | Venezuela | 96.8 /100 | #89 | Exceptional 80.1% |
| Poles | 96.8 /100 | #90 | Exceptional 80.1% |
| Uruguayans | 96.7 /100 | #91 | Exceptional 80.1% |
Demographics Similar to Spanish Americans by In Labor Force | Age 20-64
In terms of in labor force | age 20-64, the demographic groups most similar to Spanish Americans are Immigrants from Bangladesh (77.9%, a difference of 0.050%), Immigrants from the Azores (77.8%, a difference of 0.050%), African (77.9%, a difference of 0.070%), Hmong (77.9%, a difference of 0.080%), and Delaware (77.8%, a difference of 0.090%).
| Demographics | Rating | Rank | In Labor Force | Age 20-64 |
| Immigrants | Guyana | 0.0 /100 | #284 | Tragic 78.1% |
| Osage | 0.0 /100 | #285 | Tragic 78.0% |
| Immigrants | Belize | 0.0 /100 | #286 | Tragic 78.0% |
| Vietnamese | 0.0 /100 | #287 | Tragic 78.0% |
| Hmong | 0.0 /100 | #288 | Tragic 77.9% |
| Africans | 0.0 /100 | #289 | Tragic 77.9% |
| Immigrants | Bangladesh | 0.0 /100 | #290 | Tragic 77.9% |
| Spanish Americans | 0.0 /100 | #291 | Tragic 77.8% |
| Immigrants | Azores | 0.0 /100 | #292 | Tragic 77.8% |
| Delaware | 0.0 /100 | #293 | Tragic 77.8% |
| Immigrants | Central America | 0.0 /100 | #294 | Tragic 77.7% |
| Immigrants | Grenada | 0.0 /100 | #295 | Tragic 77.7% |
| Immigrants | Dominican Republic | 0.0 /100 | #296 | Tragic 77.7% |
| Dominicans | 0.0 /100 | #297 | Tragic 77.7% |
| Cree | 0.0 /100 | #298 | Tragic 77.7% |