Bhutanese vs Estonian In Labor Force | Age 20-64
COMPARE
Bhutanese
Estonian
In Labor Force | Age 20-64
In Labor Force | Age 20-64 Comparison
Bhutanese
Estonians
80.2%
IN LABOR FORCE | AGE 20-64
98.6/ 100
METRIC RATING
68th/ 347
METRIC RANK
80.0%
IN LABOR FORCE | AGE 20-64
94.0/ 100
METRIC RATING
110th/ 347
METRIC RANK
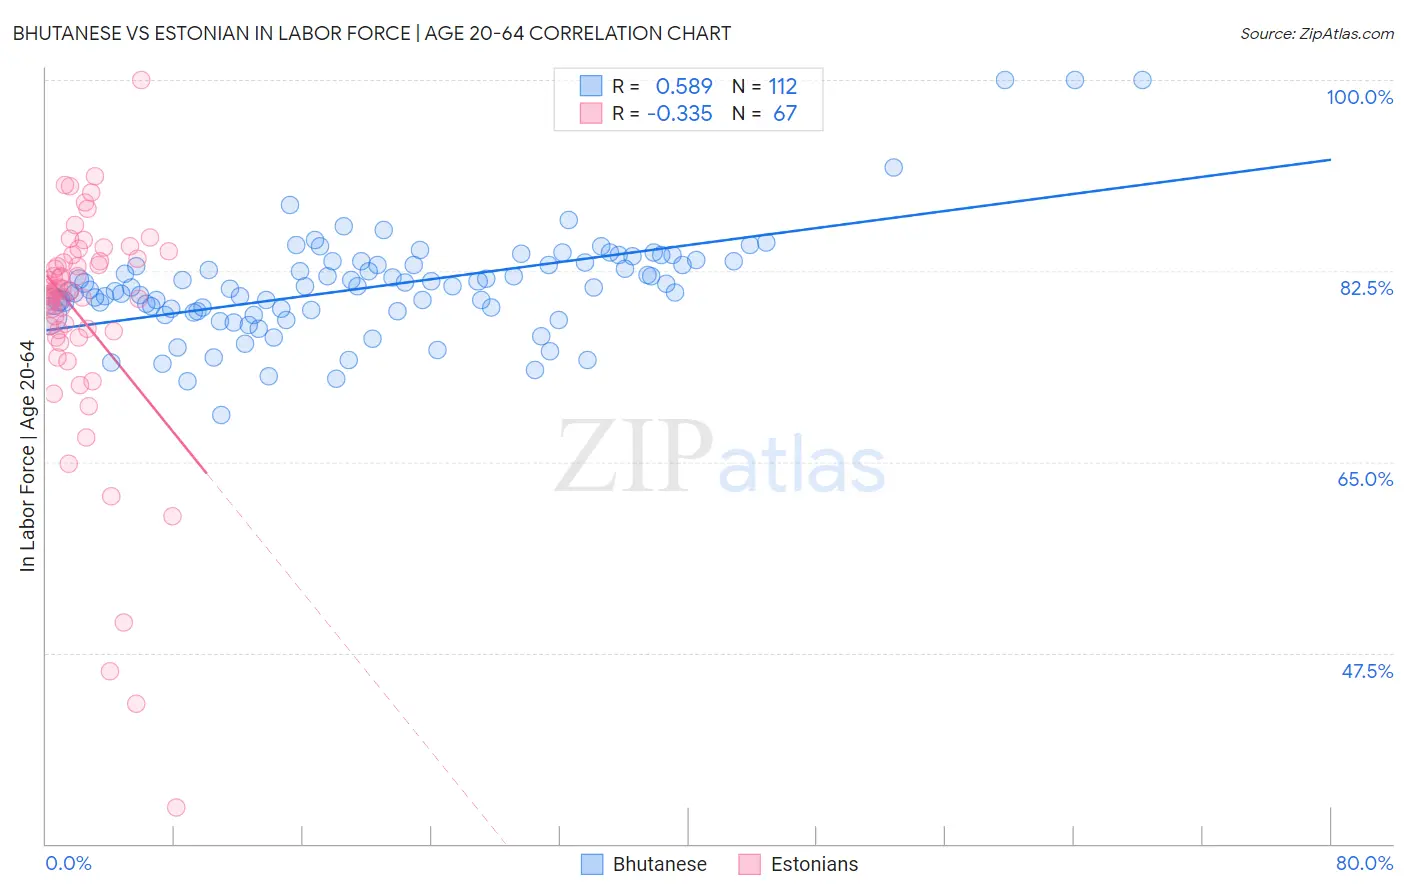
Bhutanese vs Estonian In Labor Force | Age 20-64 Correlation Chart
The statistical analysis conducted on geographies consisting of 455,602,654 people shows a substantial positive correlation between the proportion of Bhutanese and labor force participation rate among population between the ages 20 and 64 in the United States with a correlation coefficient (R) of 0.589 and weighted average of 80.2%. Similarly, the statistical analysis conducted on geographies consisting of 123,512,099 people shows a mild negative correlation between the proportion of Estonians and labor force participation rate among population between the ages 20 and 64 in the United States with a correlation coefficient (R) of -0.335 and weighted average of 80.0%, a difference of 0.30%.
In Labor Force | Age 20-64 Correlation Summary
| Measurement | Bhutanese | Estonian |
| Minimum | 69.3% | 33.3% |
| Maximum | 100.0% | 100.0% |
| Range | 30.7% | 66.7% |
| Mean | 81.1% | 78.1% |
| Median | 81.0% | 80.4% |
| Interquartile 25% (IQ1) | 78.8% | 76.4% |
| Interquartile 75% (IQ3) | 83.2% | 83.6% |
| Interquartile Range (IQR) | 4.3% | 7.2% |
| Standard Deviation (Sample) | 4.8% | 11.2% |
| Standard Deviation (Population) | 4.8% | 11.1% |
Similar Demographics by In Labor Force | Age 20-64
Demographics Similar to Bhutanese by In Labor Force | Age 20-64
In terms of in labor force | age 20-64, the demographic groups most similar to Bhutanese are Albanian (80.2%, a difference of 0.0%), Immigrants from Turkey (80.2%, a difference of 0.0%), Macedonian (80.2%, a difference of 0.010%), Taiwanese (80.2%, a difference of 0.010%), and Soviet Union (80.2%, a difference of 0.010%).
| Demographics | Rating | Rank | In Labor Force | Age 20-64 |
| Burmese | 98.8 /100 | #61 | Exceptional 80.3% |
| Carpatho Rusyns | 98.8 /100 | #62 | Exceptional 80.3% |
| Immigrants | Korea | 98.8 /100 | #63 | Exceptional 80.3% |
| Immigrants | Albania | 98.7 /100 | #64 | Exceptional 80.3% |
| Lithuanians | 98.7 /100 | #65 | Exceptional 80.2% |
| Macedonians | 98.7 /100 | #66 | Exceptional 80.2% |
| Taiwanese | 98.6 /100 | #67 | Exceptional 80.2% |
| Bhutanese | 98.6 /100 | #68 | Exceptional 80.2% |
| Albanians | 98.6 /100 | #69 | Exceptional 80.2% |
| Immigrants | Turkey | 98.5 /100 | #70 | Exceptional 80.2% |
| Soviet Union | 98.5 /100 | #71 | Exceptional 80.2% |
| Eastern Europeans | 98.4 /100 | #72 | Exceptional 80.2% |
| Cypriots | 98.2 /100 | #73 | Exceptional 80.2% |
| Immigrants | Eastern Europe | 98.1 /100 | #74 | Exceptional 80.2% |
| Immigrants | Afghanistan | 97.9 /100 | #75 | Exceptional 80.2% |
Demographics Similar to Estonians by In Labor Force | Age 20-64
In terms of in labor force | age 20-64, the demographic groups most similar to Estonians are Immigrants from Argentina (80.0%, a difference of 0.0%), Immigrants from South America (80.0%, a difference of 0.0%), Immigrants from Italy (80.0%, a difference of 0.0%), Sri Lankan (80.0%, a difference of 0.0%), and Iranian (80.0%, a difference of 0.010%).
| Demographics | Rating | Rank | In Labor Force | Age 20-64 |
| Russians | 95.5 /100 | #103 | Exceptional 80.0% |
| Venezuelans | 95.3 /100 | #104 | Exceptional 80.0% |
| Immigrants | Ghana | 95.0 /100 | #105 | Exceptional 80.0% |
| Greeks | 94.8 /100 | #106 | Exceptional 80.0% |
| Immigrants | Jordan | 94.8 /100 | #107 | Exceptional 80.0% |
| Iranians | 94.3 /100 | #108 | Exceptional 80.0% |
| Immigrants | Argentina | 94.1 /100 | #109 | Exceptional 80.0% |
| Estonians | 94.0 /100 | #110 | Exceptional 80.0% |
| Immigrants | South America | 93.9 /100 | #111 | Exceptional 80.0% |
| Immigrants | Italy | 93.9 /100 | #112 | Exceptional 80.0% |
| Sri Lankans | 93.9 /100 | #113 | Exceptional 80.0% |
| Argentineans | 93.8 /100 | #114 | Exceptional 80.0% |
| Bermudans | 93.3 /100 | #115 | Exceptional 80.0% |
| Immigrants | Western Africa | 93.1 /100 | #116 | Exceptional 80.0% |
| Immigrants | Vietnam | 92.7 /100 | #117 | Exceptional 80.0% |