South American vs Immigrants from Nicaragua In Labor Force | Age 20-24
COMPARE
South American
Immigrants from Nicaragua
In Labor Force | Age 20-24
In Labor Force | Age 20-24 Comparison
South Americans
Immigrants from Nicaragua
73.5%
IN LABOR FORCE | AGE 20-24
0.4/ 100
METRIC RATING
268th/ 347
METRIC RANK
72.9%
IN LABOR FORCE | AGE 20-24
0.0/ 100
METRIC RATING
291st/ 347
METRIC RANK
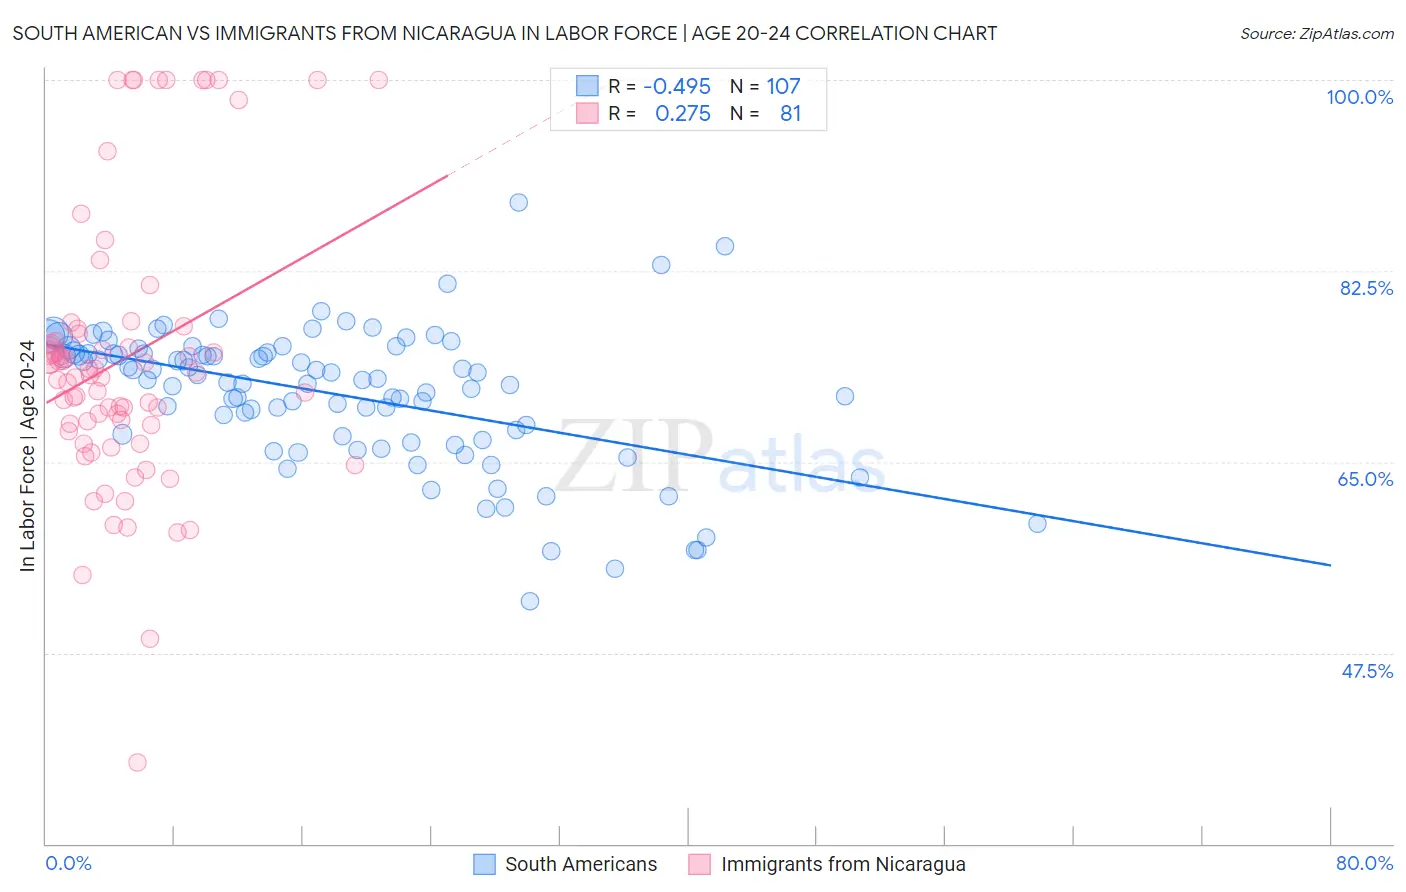
South American vs Immigrants from Nicaragua In Labor Force | Age 20-24 Correlation Chart
The statistical analysis conducted on geographies consisting of 493,868,145 people shows a moderate negative correlation between the proportion of South Americans and labor force participation rate among population between the ages 20 and 24 in the United States with a correlation coefficient (R) of -0.495 and weighted average of 73.5%. Similarly, the statistical analysis conducted on geographies consisting of 236,317,721 people shows a weak positive correlation between the proportion of Immigrants from Nicaragua and labor force participation rate among population between the ages 20 and 24 in the United States with a correlation coefficient (R) of 0.275 and weighted average of 72.9%, a difference of 0.79%.
In Labor Force | Age 20-24 Correlation Summary
| Measurement | South American | Immigrants from Nicaragua |
| Minimum | 52.2% | 37.5% |
| Maximum | 88.8% | 100.0% |
| Range | 36.6% | 62.5% |
| Mean | 71.2% | 74.5% |
| Median | 72.5% | 73.0% |
| Interquartile 25% (IQ1) | 67.3% | 68.1% |
| Interquartile 75% (IQ3) | 75.0% | 76.9% |
| Interquartile Range (IQR) | 7.7% | 8.8% |
| Standard Deviation (Sample) | 6.3% | 12.7% |
| Standard Deviation (Population) | 6.3% | 12.7% |
Similar Demographics by In Labor Force | Age 20-24
Demographics Similar to South Americans by In Labor Force | Age 20-24
In terms of in labor force | age 20-24, the demographic groups most similar to South Americans are Colombian (73.5%, a difference of 0.030%), Immigrants from Western Asia (73.5%, a difference of 0.050%), Immigrants from Russia (73.5%, a difference of 0.060%), Burmese (73.6%, a difference of 0.090%), and Haitian (73.6%, a difference of 0.090%).
| Demographics | Rating | Rank | In Labor Force | Age 20-24 |
| Houma | 0.6 /100 | #261 | Tragic 73.7% |
| Asians | 0.6 /100 | #262 | Tragic 73.7% |
| Immigrants | Asia | 0.5 /100 | #263 | Tragic 73.6% |
| Immigrants | Haiti | 0.5 /100 | #264 | Tragic 73.6% |
| Burmese | 0.5 /100 | #265 | Tragic 73.6% |
| Haitians | 0.5 /100 | #266 | Tragic 73.6% |
| Immigrants | Western Asia | 0.4 /100 | #267 | Tragic 73.5% |
| South Americans | 0.4 /100 | #268 | Tragic 73.5% |
| Colombians | 0.3 /100 | #269 | Tragic 73.5% |
| Immigrants | Russia | 0.3 /100 | #270 | Tragic 73.5% |
| Immigrants | Indonesia | 0.3 /100 | #271 | Tragic 73.4% |
| Belizeans | 0.3 /100 | #272 | Tragic 73.4% |
| Cheyenne | 0.2 /100 | #273 | Tragic 73.4% |
| Immigrants | Colombia | 0.2 /100 | #274 | Tragic 73.4% |
| Immigrants | South America | 0.2 /100 | #275 | Tragic 73.3% |
Demographics Similar to Immigrants from Nicaragua by In Labor Force | Age 20-24
In terms of in labor force | age 20-24, the demographic groups most similar to Immigrants from Nicaragua are Immigrants from Belarus (73.0%, a difference of 0.080%), Pueblo (72.9%, a difference of 0.090%), U.S. Virgin Islander (73.0%, a difference of 0.15%), Immigrants from Belize (72.8%, a difference of 0.15%), and Argentinean (73.1%, a difference of 0.18%).
| Demographics | Rating | Rank | In Labor Force | Age 20-24 |
| Kiowa | 0.1 /100 | #284 | Tragic 73.2% |
| Nicaraguans | 0.1 /100 | #285 | Tragic 73.2% |
| Immigrants | Lebanon | 0.1 /100 | #286 | Tragic 73.1% |
| Immigrants | Korea | 0.1 /100 | #287 | Tragic 73.1% |
| Argentineans | 0.1 /100 | #288 | Tragic 73.1% |
| U.S. Virgin Islanders | 0.1 /100 | #289 | Tragic 73.0% |
| Immigrants | Belarus | 0.1 /100 | #290 | Tragic 73.0% |
| Immigrants | Nicaragua | 0.0 /100 | #291 | Tragic 72.9% |
| Pueblo | 0.0 /100 | #292 | Tragic 72.9% |
| Immigrants | Belize | 0.0 /100 | #293 | Tragic 72.8% |
| Immigrants | Argentina | 0.0 /100 | #294 | Tragic 72.8% |
| Okinawans | 0.0 /100 | #295 | Tragic 72.7% |
| Jamaicans | 0.0 /100 | #296 | Tragic 72.7% |
| Central American Indians | 0.0 /100 | #297 | Tragic 72.7% |
| Israelis | 0.0 /100 | #298 | Tragic 72.6% |