Belizean vs Immigrants from Lithuania Unemployment Among Seniors over 65 years
COMPARE
Belizean
Immigrants from Lithuania
Unemployment Among Seniors over 65 years
Unemployment Among Seniors over 65 years Comparison
Belizeans
Immigrants from Lithuania
5.5%
UNEMPLOYMENT AMONG SENIORS OVER 65 YEARS
0.0/ 100
METRIC RATING
292nd/ 347
METRIC RANK
5.0%
UNEMPLOYMENT AMONG SENIORS OVER 65 YEARS
95.1/ 100
METRIC RATING
103rd/ 347
METRIC RANK
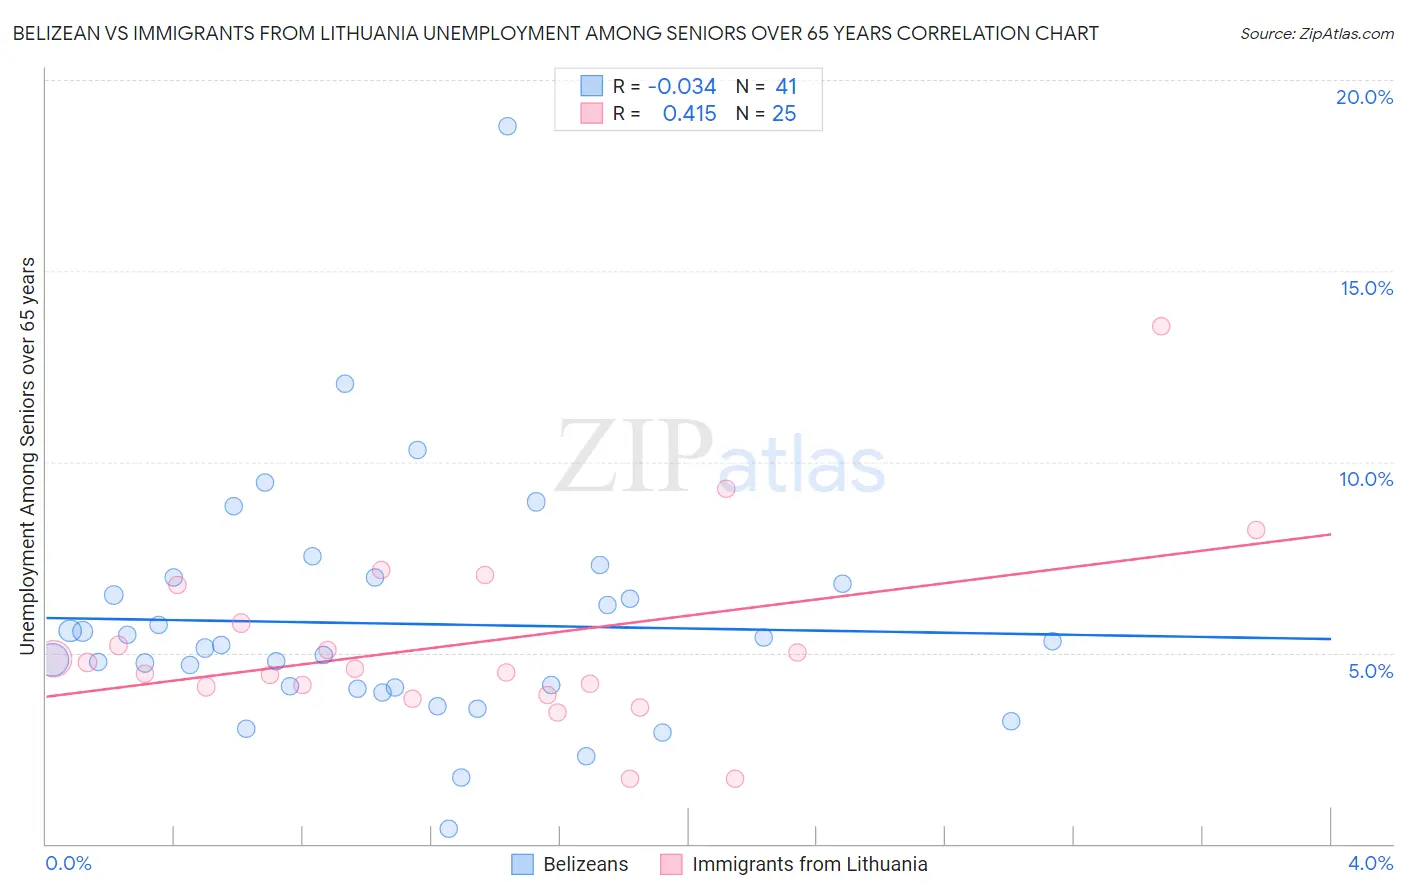
Belizean vs Immigrants from Lithuania Unemployment Among Seniors over 65 years Correlation Chart
The statistical analysis conducted on geographies consisting of 139,335,808 people shows no correlation between the proportion of Belizeans and unemployment rate amomg seniors over the age of 65 in the United States with a correlation coefficient (R) of -0.034 and weighted average of 5.5%. Similarly, the statistical analysis conducted on geographies consisting of 113,554,800 people shows a moderate positive correlation between the proportion of Immigrants from Lithuania and unemployment rate amomg seniors over the age of 65 in the United States with a correlation coefficient (R) of 0.415 and weighted average of 5.0%, a difference of 10.2%.
Unemployment Among Seniors over 65 years Correlation Summary
| Measurement | Belizean | Immigrants from Lithuania |
| Minimum | 0.41% | 1.7% |
| Maximum | 18.8% | 13.6% |
| Range | 18.4% | 11.9% |
| Mean | 5.8% | 5.2% |
| Median | 5.2% | 4.6% |
| Interquartile 25% (IQ1) | 4.1% | 4.0% |
| Interquartile 75% (IQ3) | 6.9% | 6.3% |
| Interquartile Range (IQR) | 2.8% | 2.3% |
| Standard Deviation (Sample) | 3.1% | 2.5% |
| Standard Deviation (Population) | 3.1% | 2.4% |
Similar Demographics by Unemployment Among Seniors over 65 years
Demographics Similar to Belizeans by Unemployment Among Seniors over 65 years
In terms of unemployment among seniors over 65 years, the demographic groups most similar to Belizeans are Immigrants from Venezuela (5.5%, a difference of 0.040%), Armenian (5.5%, a difference of 0.080%), Black/African American (5.5%, a difference of 0.15%), Cheyenne (5.5%, a difference of 0.15%), and Cape Verdean (5.5%, a difference of 0.15%).
| Demographics | Rating | Rank | Unemployment Among Seniors over 65 years |
| Central Americans | 0.0 /100 | #285 | Tragic 5.5% |
| Immigrants | Barbados | 0.0 /100 | #286 | Tragic 5.5% |
| Venezuelans | 0.0 /100 | #287 | Tragic 5.5% |
| U.S. Virgin Islanders | 0.0 /100 | #288 | Tragic 5.5% |
| Immigrants | Cabo Verde | 0.0 /100 | #289 | Tragic 5.5% |
| Jamaicans | 0.0 /100 | #290 | Tragic 5.5% |
| Blacks/African Americans | 0.0 /100 | #291 | Tragic 5.5% |
| Belizeans | 0.0 /100 | #292 | Tragic 5.5% |
| Immigrants | Venezuela | 0.0 /100 | #293 | Tragic 5.5% |
| Armenians | 0.0 /100 | #294 | Tragic 5.5% |
| Cheyenne | 0.0 /100 | #295 | Tragic 5.5% |
| Cape Verdeans | 0.0 /100 | #296 | Tragic 5.5% |
| Yaqui | 0.0 /100 | #297 | Tragic 5.5% |
| Immigrants | West Indies | 0.0 /100 | #298 | Tragic 5.6% |
| Guyanese | 0.0 /100 | #299 | Tragic 5.6% |
Demographics Similar to Immigrants from Lithuania by Unemployment Among Seniors over 65 years
In terms of unemployment among seniors over 65 years, the demographic groups most similar to Immigrants from Lithuania are Immigrants from Scotland (5.0%, a difference of 0.020%), Immigrants from Thailand (5.0%, a difference of 0.050%), Yugoslavian (5.0%, a difference of 0.060%), Okinawan (5.0%, a difference of 0.070%), and Romanian (5.0%, a difference of 0.080%).
| Demographics | Rating | Rank | Unemployment Among Seniors over 65 years |
| Immigrants | Singapore | 96.8 /100 | #96 | Exceptional 5.0% |
| Immigrants | Oceania | 96.8 /100 | #97 | Exceptional 5.0% |
| Czechoslovakians | 96.7 /100 | #98 | Exceptional 5.0% |
| South Africans | 96.5 /100 | #99 | Exceptional 5.0% |
| Romanians | 95.5 /100 | #100 | Exceptional 5.0% |
| Yugoslavians | 95.4 /100 | #101 | Exceptional 5.0% |
| Immigrants | Thailand | 95.4 /100 | #102 | Exceptional 5.0% |
| Immigrants | Lithuania | 95.1 /100 | #103 | Exceptional 5.0% |
| Immigrants | Scotland | 95.0 /100 | #104 | Exceptional 5.0% |
| Okinawans | 94.7 /100 | #105 | Exceptional 5.0% |
| Immigrants | Turkey | 94.3 /100 | #106 | Exceptional 5.0% |
| Immigrants | Germany | 93.2 /100 | #107 | Exceptional 5.0% |
| Immigrants | Vietnam | 92.9 /100 | #108 | Exceptional 5.0% |
| Immigrants | Malaysia | 92.7 /100 | #109 | Exceptional 5.0% |
| Immigrants | Saudi Arabia | 92.7 /100 | #110 | Exceptional 5.0% |