Bahamian vs Danish Unemployment Among Women with Children Under 6 years
COMPARE
Bahamian
Danish
Unemployment Among Women with Children Under 6 years
Unemployment Among Women with Children Under 6 years Comparison
Bahamians
Danes
8.7%
UNEMPLOYMENT AMONG WOMEN WITH CHILDREN UNDER 6 YEARS
0.0/ 100
METRIC RATING
288th/ 347
METRIC RANK
7.1%
UNEMPLOYMENT AMONG WOMEN WITH CHILDREN UNDER 6 YEARS
98.2/ 100
METRIC RATING
91st/ 347
METRIC RANK
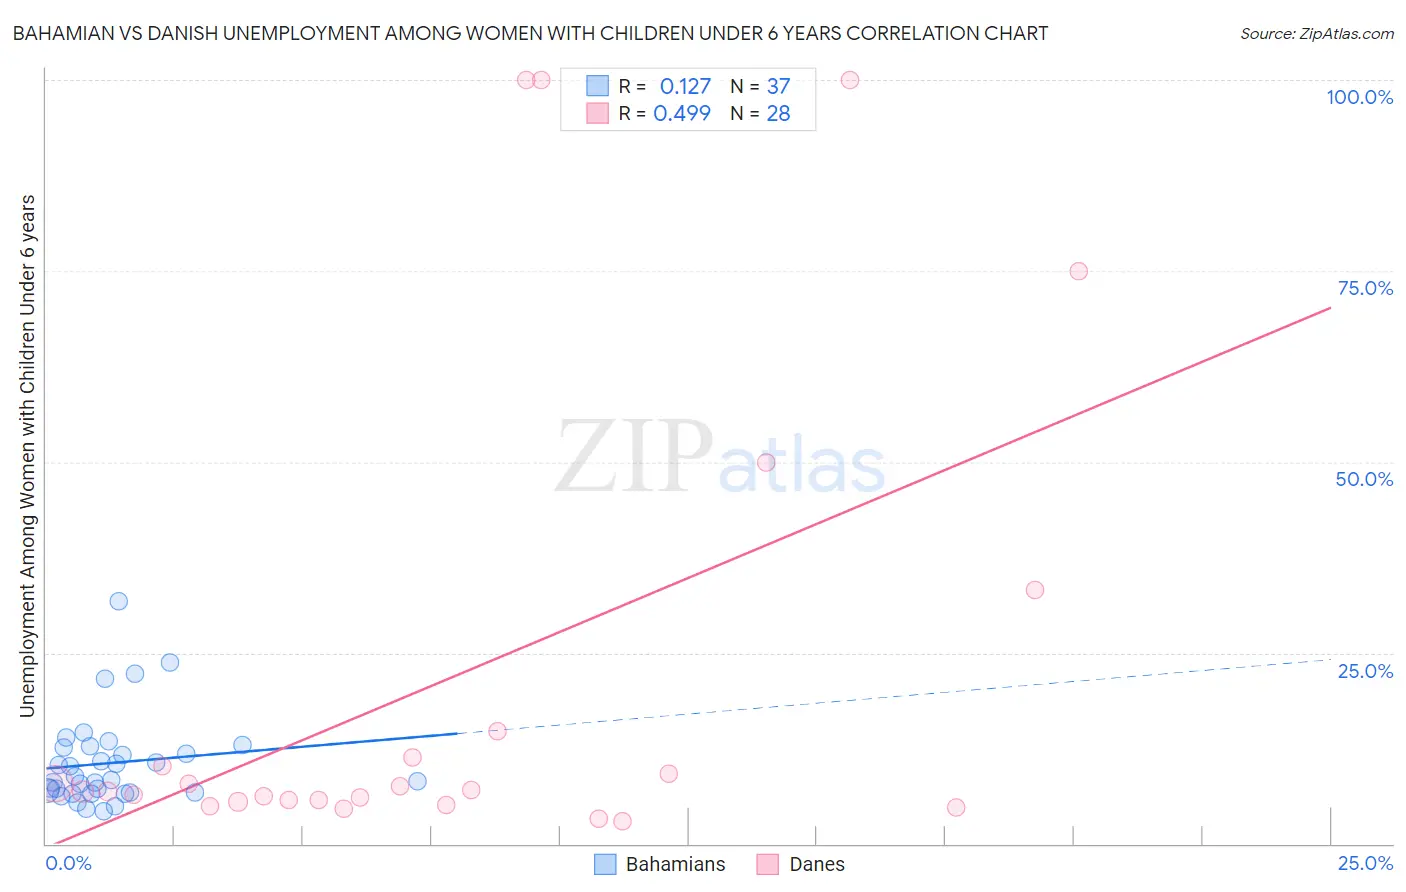
Bahamian vs Danish Unemployment Among Women with Children Under 6 years Correlation Chart
The statistical analysis conducted on geographies consisting of 100,229,673 people shows a poor positive correlation between the proportion of Bahamians and unemployment rate among women with children under the age of 6 in the United States with a correlation coefficient (R) of 0.127 and weighted average of 8.7%. Similarly, the statistical analysis conducted on geographies consisting of 332,454,296 people shows a moderate positive correlation between the proportion of Danes and unemployment rate among women with children under the age of 6 in the United States with a correlation coefficient (R) of 0.499 and weighted average of 7.1%, a difference of 22.3%.
Unemployment Among Women with Children Under 6 years Correlation Summary
| Measurement | Bahamian | Danish |
| Minimum | 4.3% | 3.0% |
| Maximum | 31.8% | 100.0% |
| Range | 27.5% | 97.0% |
| Mean | 10.6% | 21.7% |
| Median | 8.4% | 6.9% |
| Interquartile 25% (IQ1) | 6.7% | 5.6% |
| Interquartile 75% (IQ3) | 12.7% | 13.0% |
| Interquartile Range (IQR) | 6.0% | 7.4% |
| Standard Deviation (Sample) | 5.9% | 31.7% |
| Standard Deviation (Population) | 5.8% | 31.2% |
Similar Demographics by Unemployment Among Women with Children Under 6 years
Demographics Similar to Bahamians by Unemployment Among Women with Children Under 6 years
In terms of unemployment among women with children under 6 years, the demographic groups most similar to Bahamians are Iroquois (8.7%, a difference of 0.11%), Menominee (8.7%, a difference of 0.20%), Vietnamese (8.8%, a difference of 0.26%), U.S. Virgin Islander (8.7%, a difference of 0.35%), and Seminole (8.7%, a difference of 0.35%).
| Demographics | Rating | Rank | Unemployment Among Women with Children Under 6 years |
| Guatemalans | 0.0 /100 | #281 | Tragic 8.7% |
| Bermudans | 0.0 /100 | #282 | Tragic 8.7% |
| Spanish American Indians | 0.0 /100 | #283 | Tragic 8.7% |
| Blackfeet | 0.0 /100 | #284 | Tragic 8.7% |
| U.S. Virgin Islanders | 0.0 /100 | #285 | Tragic 8.7% |
| Seminole | 0.0 /100 | #286 | Tragic 8.7% |
| Menominee | 0.0 /100 | #287 | Tragic 8.7% |
| Bahamians | 0.0 /100 | #288 | Tragic 8.7% |
| Iroquois | 0.0 /100 | #289 | Tragic 8.7% |
| Vietnamese | 0.0 /100 | #290 | Tragic 8.8% |
| Jamaicans | 0.0 /100 | #291 | Tragic 8.8% |
| Cheyenne | 0.0 /100 | #292 | Tragic 8.8% |
| Immigrants | Bangladesh | 0.0 /100 | #293 | Tragic 8.8% |
| Immigrants | Nonimmigrants | 0.0 /100 | #294 | Tragic 8.8% |
| Immigrants | Central America | 0.0 /100 | #295 | Tragic 8.9% |
Demographics Similar to Danes by Unemployment Among Women with Children Under 6 years
In terms of unemployment among women with children under 6 years, the demographic groups most similar to Danes are Immigrants from Spain (7.1%, a difference of 0.060%), Immigrants from Denmark (7.1%, a difference of 0.12%), Albanian (7.2%, a difference of 0.14%), Immigrants from Hungary (7.1%, a difference of 0.16%), and Alsatian (7.1%, a difference of 0.28%).
| Demographics | Rating | Rank | Unemployment Among Women with Children Under 6 years |
| Immigrants | Albania | 98.7 /100 | #84 | Exceptional 7.1% |
| Immigrants | Romania | 98.7 /100 | #85 | Exceptional 7.1% |
| Immigrants | Zimbabwe | 98.6 /100 | #86 | Exceptional 7.1% |
| Alsatians | 98.4 /100 | #87 | Exceptional 7.1% |
| Immigrants | Hungary | 98.3 /100 | #88 | Exceptional 7.1% |
| Immigrants | Denmark | 98.3 /100 | #89 | Exceptional 7.1% |
| Immigrants | Spain | 98.2 /100 | #90 | Exceptional 7.1% |
| Danes | 98.2 /100 | #91 | Exceptional 7.1% |
| Albanians | 98.0 /100 | #92 | Exceptional 7.2% |
| New Zealanders | 97.8 /100 | #93 | Exceptional 7.2% |
| Macedonians | 97.7 /100 | #94 | Exceptional 7.2% |
| Romanians | 97.7 /100 | #95 | Exceptional 7.2% |
| Immigrants | Eastern Africa | 97.7 /100 | #96 | Exceptional 7.2% |
| Immigrants | South Eastern Asia | 97.6 /100 | #97 | Exceptional 7.2% |
| Russians | 97.5 /100 | #98 | Exceptional 7.2% |