Austrian vs Immigrants from Eritrea In Labor Force | Age 45-54
COMPARE
Austrian
Immigrants from Eritrea
In Labor Force | Age 45-54
In Labor Force | Age 45-54 Comparison
Austrians
Immigrants from Eritrea
83.0%
IN LABOR FORCE | AGE 45-54
81.3/ 100
METRIC RATING
135th/ 347
METRIC RANK
83.8%
IN LABOR FORCE | AGE 45-54
99.7/ 100
METRIC RATING
31st/ 347
METRIC RANK
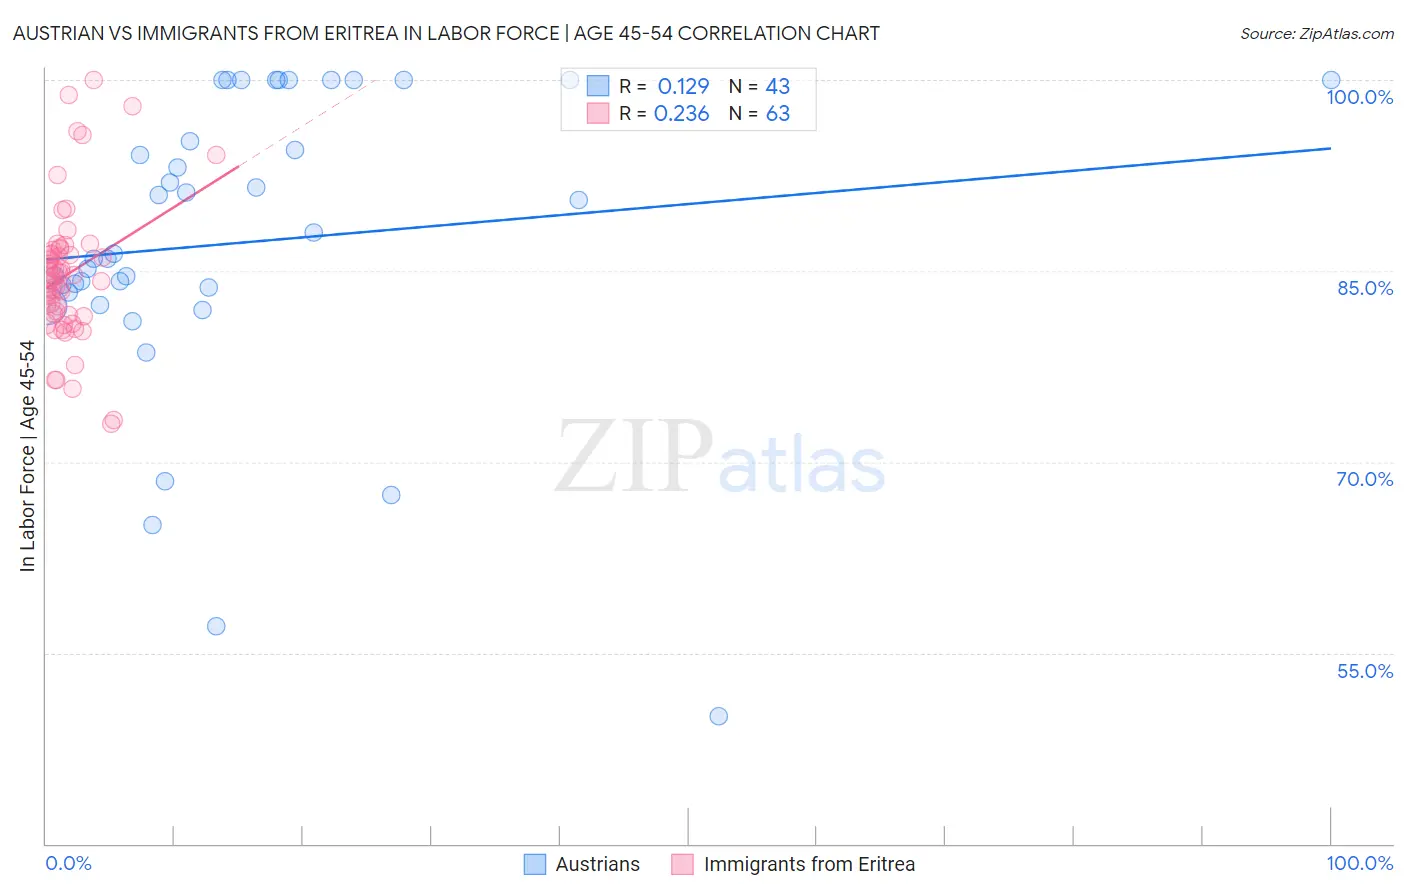
Austrian vs Immigrants from Eritrea In Labor Force | Age 45-54 Correlation Chart
The statistical analysis conducted on geographies consisting of 451,779,620 people shows a poor positive correlation between the proportion of Austrians and labor force participation rate among population between the ages 45 and 54 in the United States with a correlation coefficient (R) of 0.129 and weighted average of 83.0%. Similarly, the statistical analysis conducted on geographies consisting of 104,844,448 people shows a weak positive correlation between the proportion of Immigrants from Eritrea and labor force participation rate among population between the ages 45 and 54 in the United States with a correlation coefficient (R) of 0.236 and weighted average of 83.8%, a difference of 0.94%.
In Labor Force | Age 45-54 Correlation Summary
| Measurement | Austrian | Immigrants from Eritrea |
| Minimum | 50.0% | 73.0% |
| Maximum | 100.0% | 100.0% |
| Range | 50.0% | 27.0% |
| Mean | 87.2% | 84.7% |
| Median | 86.4% | 84.6% |
| Interquartile 25% (IQ1) | 83.3% | 81.5% |
| Interquartile 75% (IQ3) | 100.0% | 86.7% |
| Interquartile Range (IQR) | 16.7% | 5.2% |
| Standard Deviation (Sample) | 11.8% | 5.5% |
| Standard Deviation (Population) | 11.7% | 5.4% |
Similar Demographics by In Labor Force | Age 45-54
Demographics Similar to Austrians by In Labor Force | Age 45-54
In terms of in labor force | age 45-54, the demographic groups most similar to Austrians are Immigrants from Kazakhstan (83.0%, a difference of 0.0%), Sudanese (83.0%, a difference of 0.010%), Immigrants from Spain (83.0%, a difference of 0.010%), Liberian (83.0%, a difference of 0.020%), and Ghanaian (83.0%, a difference of 0.020%).
| Demographics | Rating | Rank | In Labor Force | Age 45-54 |
| Germans | 85.1 /100 | #128 | Excellent 83.1% |
| Immigrants | Northern Europe | 85.1 /100 | #129 | Excellent 83.1% |
| Immigrants | Israel | 84.7 /100 | #130 | Excellent 83.1% |
| Finns | 83.3 /100 | #131 | Excellent 83.1% |
| Immigrants | Ukraine | 82.9 /100 | #132 | Excellent 83.0% |
| Liberians | 82.7 /100 | #133 | Excellent 83.0% |
| Sudanese | 82.0 /100 | #134 | Excellent 83.0% |
| Austrians | 81.3 /100 | #135 | Excellent 83.0% |
| Immigrants | Kazakhstan | 81.0 /100 | #136 | Excellent 83.0% |
| Immigrants | Spain | 80.4 /100 | #137 | Excellent 83.0% |
| Ghanaians | 79.5 /100 | #138 | Good 83.0% |
| Scandinavians | 78.5 /100 | #139 | Good 83.0% |
| Yugoslavians | 78.3 /100 | #140 | Good 83.0% |
| Immigrants | Haiti | 77.9 /100 | #141 | Good 83.0% |
| Immigrants | Scotland | 77.8 /100 | #142 | Good 83.0% |
Demographics Similar to Immigrants from Eritrea by In Labor Force | Age 45-54
In terms of in labor force | age 45-54, the demographic groups most similar to Immigrants from Eritrea are Immigrants from Bulgaria (83.8%, a difference of 0.020%), Turkish (83.8%, a difference of 0.020%), Latvian (83.8%, a difference of 0.020%), Immigrants from Pakistan (83.8%, a difference of 0.050%), and Immigrants from Lithuania (83.9%, a difference of 0.070%).
| Demographics | Rating | Rank | In Labor Force | Age 45-54 |
| Slovenes | 99.8 /100 | #24 | Exceptional 83.9% |
| Immigrants | North Macedonia | 99.8 /100 | #25 | Exceptional 83.9% |
| Immigrants | Serbia | 99.8 /100 | #26 | Exceptional 83.9% |
| Immigrants | Brazil | 99.8 /100 | #27 | Exceptional 83.9% |
| Immigrants | Lithuania | 99.8 /100 | #28 | Exceptional 83.9% |
| Immigrants | Pakistan | 99.7 /100 | #29 | Exceptional 83.8% |
| Immigrants | Bulgaria | 99.7 /100 | #30 | Exceptional 83.8% |
| Immigrants | Eritrea | 99.7 /100 | #31 | Exceptional 83.8% |
| Turks | 99.7 /100 | #32 | Exceptional 83.8% |
| Latvians | 99.7 /100 | #33 | Exceptional 83.8% |
| Kenyans | 99.5 /100 | #34 | Exceptional 83.7% |
| Brazilians | 99.5 /100 | #35 | Exceptional 83.7% |
| Ugandans | 99.5 /100 | #36 | Exceptional 83.7% |
| Swedes | 99.4 /100 | #37 | Exceptional 83.7% |
| Immigrants | Venezuela | 99.4 /100 | #38 | Exceptional 83.7% |