Austrian vs Immigrants from North America In Labor Force | Age 45-54
COMPARE
Austrian
Immigrants from North America
In Labor Force | Age 45-54
In Labor Force | Age 45-54 Comparison
Austrians
Immigrants from North America
83.0%
IN LABOR FORCE | AGE 45-54
81.3/ 100
METRIC RATING
135th/ 347
METRIC RANK
82.5%
IN LABOR FORCE | AGE 45-54
18.8/ 100
METRIC RATING
196th/ 347
METRIC RANK
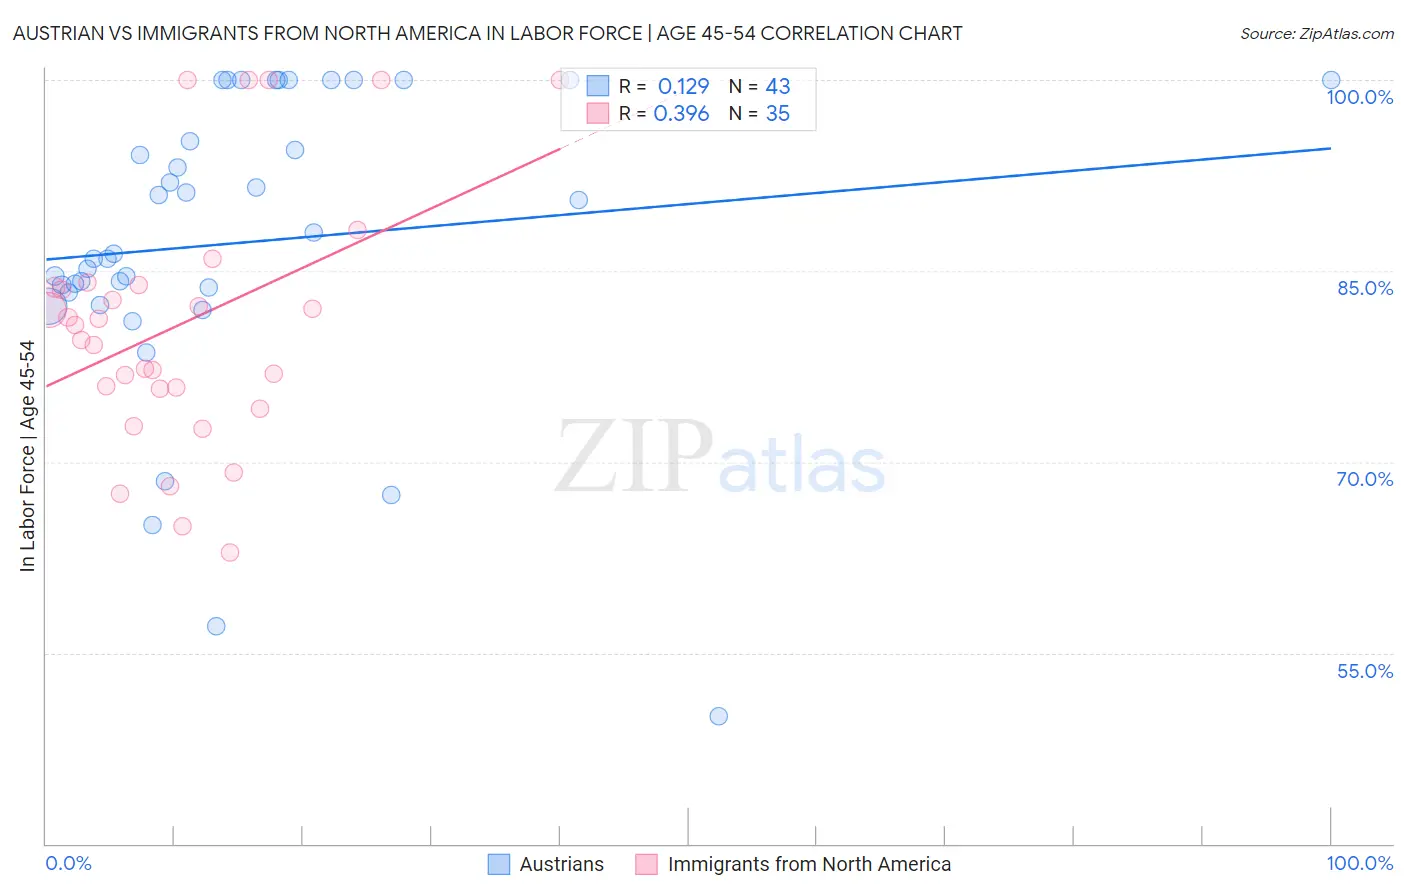
Austrian vs Immigrants from North America In Labor Force | Age 45-54 Correlation Chart
The statistical analysis conducted on geographies consisting of 451,779,620 people shows a poor positive correlation between the proportion of Austrians and labor force participation rate among population between the ages 45 and 54 in the United States with a correlation coefficient (R) of 0.129 and weighted average of 83.0%. Similarly, the statistical analysis conducted on geographies consisting of 462,161,293 people shows a mild positive correlation between the proportion of Immigrants from North America and labor force participation rate among population between the ages 45 and 54 in the United States with a correlation coefficient (R) of 0.396 and weighted average of 82.5%, a difference of 0.65%.
In Labor Force | Age 45-54 Correlation Summary
| Measurement | Austrian | Immigrants from North America |
| Minimum | 50.0% | 62.8% |
| Maximum | 100.0% | 100.0% |
| Range | 50.0% | 37.2% |
| Mean | 87.2% | 80.8% |
| Median | 86.4% | 80.7% |
| Interquartile 25% (IQ1) | 83.3% | 75.8% |
| Interquartile 75% (IQ3) | 100.0% | 83.9% |
| Interquartile Range (IQR) | 16.7% | 8.1% |
| Standard Deviation (Sample) | 11.8% | 9.9% |
| Standard Deviation (Population) | 11.7% | 9.7% |
Similar Demographics by In Labor Force | Age 45-54
Demographics Similar to Austrians by In Labor Force | Age 45-54
In terms of in labor force | age 45-54, the demographic groups most similar to Austrians are Immigrants from Kazakhstan (83.0%, a difference of 0.0%), Sudanese (83.0%, a difference of 0.010%), Immigrants from Spain (83.0%, a difference of 0.010%), Liberian (83.0%, a difference of 0.020%), and Ghanaian (83.0%, a difference of 0.020%).
| Demographics | Rating | Rank | In Labor Force | Age 45-54 |
| Germans | 85.1 /100 | #128 | Excellent 83.1% |
| Immigrants | Northern Europe | 85.1 /100 | #129 | Excellent 83.1% |
| Immigrants | Israel | 84.7 /100 | #130 | Excellent 83.1% |
| Finns | 83.3 /100 | #131 | Excellent 83.1% |
| Immigrants | Ukraine | 82.9 /100 | #132 | Excellent 83.0% |
| Liberians | 82.7 /100 | #133 | Excellent 83.0% |
| Sudanese | 82.0 /100 | #134 | Excellent 83.0% |
| Austrians | 81.3 /100 | #135 | Excellent 83.0% |
| Immigrants | Kazakhstan | 81.0 /100 | #136 | Excellent 83.0% |
| Immigrants | Spain | 80.4 /100 | #137 | Excellent 83.0% |
| Ghanaians | 79.5 /100 | #138 | Good 83.0% |
| Scandinavians | 78.5 /100 | #139 | Good 83.0% |
| Yugoslavians | 78.3 /100 | #140 | Good 83.0% |
| Immigrants | Haiti | 77.9 /100 | #141 | Good 83.0% |
| Immigrants | Scotland | 77.8 /100 | #142 | Good 83.0% |
Demographics Similar to Immigrants from North America by In Labor Force | Age 45-54
In terms of in labor force | age 45-54, the demographic groups most similar to Immigrants from North America are Lebanese (82.5%, a difference of 0.010%), Immigrants from Denmark (82.5%, a difference of 0.010%), Immigrants from Canada (82.5%, a difference of 0.020%), Immigrants from Iraq (82.5%, a difference of 0.030%), and Australian (82.5%, a difference of 0.030%).
| Demographics | Rating | Rank | In Labor Force | Age 45-54 |
| Syrians | 26.0 /100 | #189 | Fair 82.6% |
| British | 25.7 /100 | #190 | Fair 82.6% |
| Armenians | 23.2 /100 | #191 | Fair 82.5% |
| Immigrants | Iraq | 20.9 /100 | #192 | Fair 82.5% |
| Australians | 20.8 /100 | #193 | Fair 82.5% |
| Immigrants | Norway | 20.7 /100 | #194 | Fair 82.5% |
| Immigrants | Canada | 20.0 /100 | #195 | Fair 82.5% |
| Immigrants | North America | 18.8 /100 | #196 | Poor 82.5% |
| Lebanese | 18.2 /100 | #197 | Poor 82.5% |
| Immigrants | Denmark | 17.9 /100 | #198 | Poor 82.5% |
| Moroccans | 15.7 /100 | #199 | Poor 82.5% |
| French Canadians | 15.4 /100 | #200 | Poor 82.5% |
| Canadians | 15.1 /100 | #201 | Poor 82.4% |
| Immigrants | Western Asia | 14.9 /100 | #202 | Poor 82.4% |
| Arabs | 11.6 /100 | #203 | Poor 82.4% |