Austrian vs Guatemalan In Labor Force | Age 20-24
COMPARE
Austrian
Guatemalan
In Labor Force | Age 20-24
In Labor Force | Age 20-24 Comparison
Austrians
Guatemalans
76.5%
IN LABOR FORCE | AGE 20-24
99.4/ 100
METRIC RATING
84th/ 347
METRIC RANK
75.3%
IN LABOR FORCE | AGE 20-24
72.3/ 100
METRIC RATING
153rd/ 347
METRIC RANK
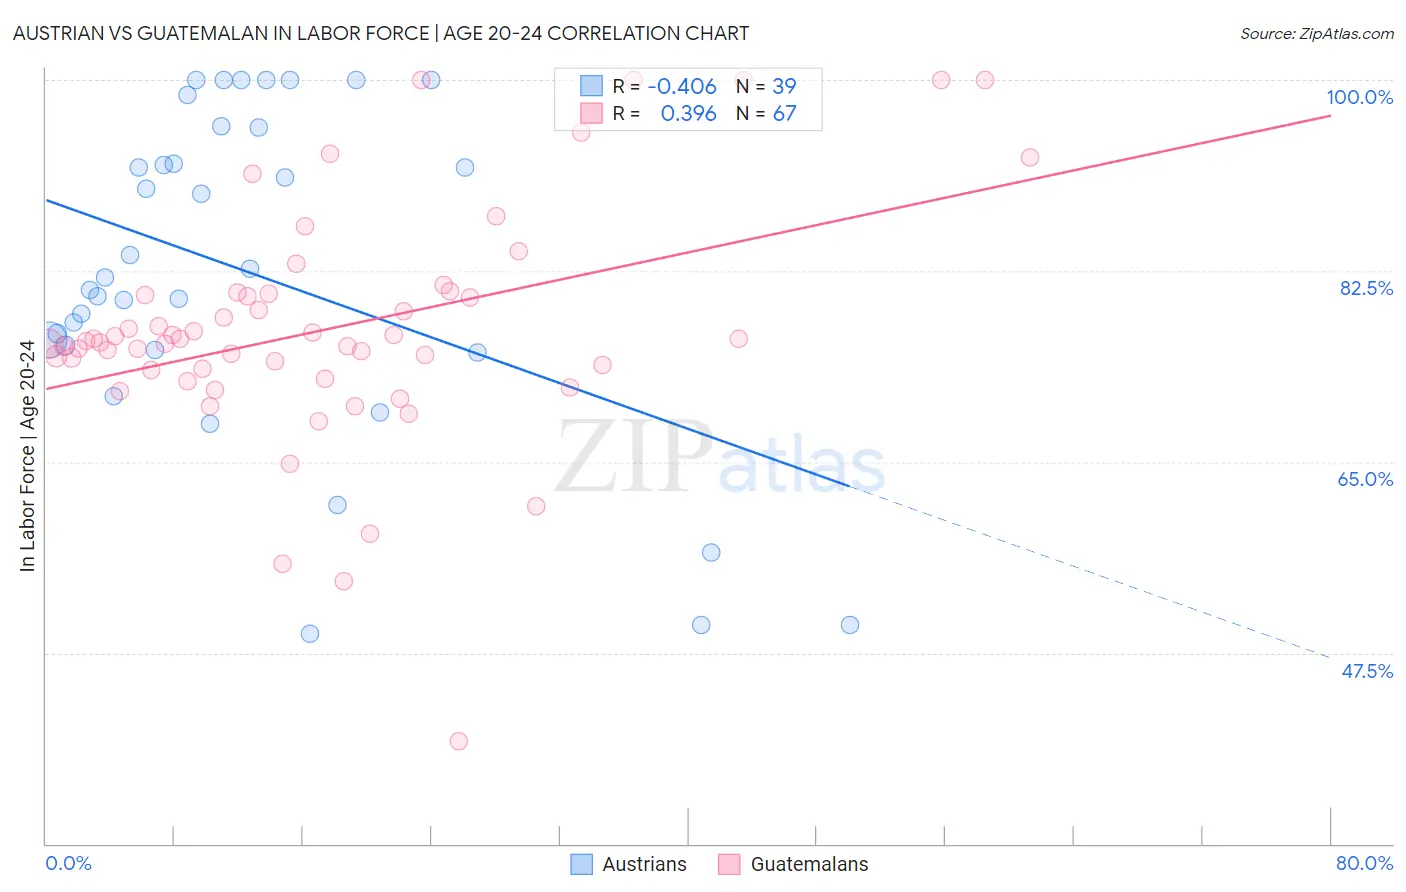
Austrian vs Guatemalan In Labor Force | Age 20-24 Correlation Chart
The statistical analysis conducted on geographies consisting of 451,655,464 people shows a moderate negative correlation between the proportion of Austrians and labor force participation rate among population between the ages 20 and 24 in the United States with a correlation coefficient (R) of -0.406 and weighted average of 76.5%. Similarly, the statistical analysis conducted on geographies consisting of 409,475,190 people shows a mild positive correlation between the proportion of Guatemalans and labor force participation rate among population between the ages 20 and 24 in the United States with a correlation coefficient (R) of 0.396 and weighted average of 75.3%, a difference of 1.5%.
In Labor Force | Age 20-24 Correlation Summary
| Measurement | Austrian | Guatemalan |
| Minimum | 49.2% | 39.4% |
| Maximum | 100.0% | 100.0% |
| Range | 50.8% | 60.6% |
| Mean | 82.3% | 77.2% |
| Median | 81.9% | 76.1% |
| Interquartile 25% (IQ1) | 75.3% | 73.4% |
| Interquartile 75% (IQ3) | 95.6% | 80.4% |
| Interquartile Range (IQR) | 20.3% | 7.0% |
| Standard Deviation (Sample) | 14.9% | 10.8% |
| Standard Deviation (Population) | 14.7% | 10.7% |
Similar Demographics by In Labor Force | Age 20-24
Demographics Similar to Austrians by In Labor Force | Age 20-24
In terms of in labor force | age 20-24, the demographic groups most similar to Austrians are Carpatho Rusyn (76.5%, a difference of 0.010%), Portuguese (76.4%, a difference of 0.030%), Immigrants from Iraq (76.4%, a difference of 0.050%), Immigrants from Thailand (76.4%, a difference of 0.050%), and Basque (76.5%, a difference of 0.10%).
| Demographics | Rating | Rank | In Labor Force | Age 20-24 |
| Immigrants | Cameroon | 99.6 /100 | #77 | Exceptional 76.6% |
| Canadians | 99.6 /100 | #78 | Exceptional 76.6% |
| Immigrants | Zaire | 99.6 /100 | #79 | Exceptional 76.6% |
| Italians | 99.6 /100 | #80 | Exceptional 76.5% |
| Basques | 99.5 /100 | #81 | Exceptional 76.5% |
| Hmong | 99.5 /100 | #82 | Exceptional 76.5% |
| Carpatho Rusyns | 99.4 /100 | #83 | Exceptional 76.5% |
| Austrians | 99.4 /100 | #84 | Exceptional 76.5% |
| Portuguese | 99.3 /100 | #85 | Exceptional 76.4% |
| Immigrants | Iraq | 99.3 /100 | #86 | Exceptional 76.4% |
| Immigrants | Thailand | 99.3 /100 | #87 | Exceptional 76.4% |
| Spanish | 99.2 /100 | #88 | Exceptional 76.4% |
| Bulgarians | 99.2 /100 | #89 | Exceptional 76.4% |
| Immigrants | Burma/Myanmar | 99.1 /100 | #90 | Exceptional 76.3% |
| Sierra Leoneans | 99.0 /100 | #91 | Exceptional 76.3% |
Demographics Similar to Guatemalans by In Labor Force | Age 20-24
In terms of in labor force | age 20-24, the demographic groups most similar to Guatemalans are Osage (75.3%, a difference of 0.0%), Immigrants from Guatemala (75.3%, a difference of 0.010%), Immigrants from El Salvador (75.3%, a difference of 0.010%), Immigrants from Western Europe (75.3%, a difference of 0.010%), and Lebanese (75.3%, a difference of 0.020%).
| Demographics | Rating | Rank | In Labor Force | Age 20-24 |
| Mexican American Indians | 78.8 /100 | #146 | Good 75.4% |
| Comanche | 77.6 /100 | #147 | Good 75.4% |
| Immigrants | Cambodia | 76.7 /100 | #148 | Good 75.4% |
| Ugandans | 76.1 /100 | #149 | Good 75.4% |
| Salvadorans | 74.8 /100 | #150 | Good 75.3% |
| Paiute | 74.1 /100 | #151 | Good 75.3% |
| Lebanese | 73.5 /100 | #152 | Good 75.3% |
| Guatemalans | 72.3 /100 | #153 | Good 75.3% |
| Osage | 72.3 /100 | #154 | Good 75.3% |
| Immigrants | Guatemala | 71.9 /100 | #155 | Good 75.3% |
| Immigrants | El Salvador | 71.7 /100 | #156 | Good 75.3% |
| Immigrants | Western Europe | 71.5 /100 | #157 | Good 75.3% |
| Immigrants | Bolivia | 71.0 /100 | #158 | Good 75.3% |
| South American Indians | 69.0 /100 | #159 | Good 75.3% |
| Japanese | 68.7 /100 | #160 | Good 75.3% |