Austrian vs Yakama In Labor Force | Age 20-24
COMPARE
Austrian
Yakama
In Labor Force | Age 20-24
In Labor Force | Age 20-24 Comparison
Austrians
Yakama
76.5%
IN LABOR FORCE | AGE 20-24
99.4/ 100
METRIC RATING
84th/ 347
METRIC RANK
75.1%
IN LABOR FORCE | AGE 20-24
50.8/ 100
METRIC RATING
172nd/ 347
METRIC RANK
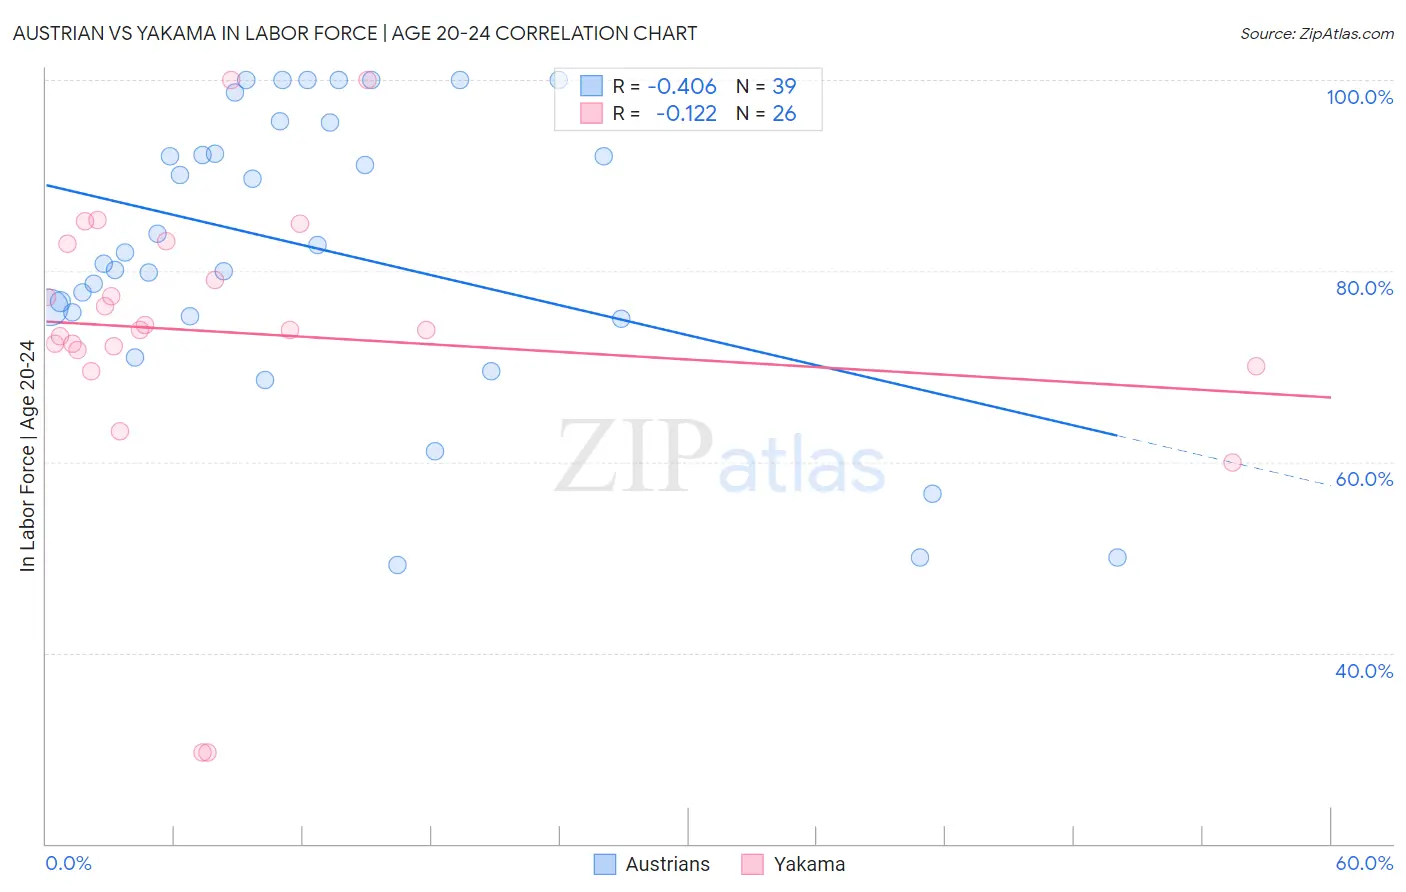
Austrian vs Yakama In Labor Force | Age 20-24 Correlation Chart
The statistical analysis conducted on geographies consisting of 451,655,464 people shows a moderate negative correlation between the proportion of Austrians and labor force participation rate among population between the ages 20 and 24 in the United States with a correlation coefficient (R) of -0.406 and weighted average of 76.5%. Similarly, the statistical analysis conducted on geographies consisting of 19,914,894 people shows a poor negative correlation between the proportion of Yakama and labor force participation rate among population between the ages 20 and 24 in the United States with a correlation coefficient (R) of -0.122 and weighted average of 75.1%, a difference of 1.9%.
In Labor Force | Age 20-24 Correlation Summary
| Measurement | Austrian | Yakama |
| Minimum | 49.2% | 29.6% |
| Maximum | 100.0% | 100.0% |
| Range | 50.8% | 70.4% |
| Mean | 82.3% | 73.5% |
| Median | 81.9% | 73.8% |
| Interquartile 25% (IQ1) | 75.3% | 71.8% |
| Interquartile 75% (IQ3) | 95.6% | 82.9% |
| Interquartile Range (IQR) | 20.3% | 11.1% |
| Standard Deviation (Sample) | 14.9% | 15.8% |
| Standard Deviation (Population) | 14.7% | 15.5% |
Similar Demographics by In Labor Force | Age 20-24
Demographics Similar to Austrians by In Labor Force | Age 20-24
In terms of in labor force | age 20-24, the demographic groups most similar to Austrians are Carpatho Rusyn (76.5%, a difference of 0.010%), Portuguese (76.4%, a difference of 0.030%), Immigrants from Iraq (76.4%, a difference of 0.050%), Immigrants from Thailand (76.4%, a difference of 0.050%), and Basque (76.5%, a difference of 0.10%).
| Demographics | Rating | Rank | In Labor Force | Age 20-24 |
| Immigrants | Cameroon | 99.6 /100 | #77 | Exceptional 76.6% |
| Canadians | 99.6 /100 | #78 | Exceptional 76.6% |
| Immigrants | Zaire | 99.6 /100 | #79 | Exceptional 76.6% |
| Italians | 99.6 /100 | #80 | Exceptional 76.5% |
| Basques | 99.5 /100 | #81 | Exceptional 76.5% |
| Hmong | 99.5 /100 | #82 | Exceptional 76.5% |
| Carpatho Rusyns | 99.4 /100 | #83 | Exceptional 76.5% |
| Austrians | 99.4 /100 | #84 | Exceptional 76.5% |
| Portuguese | 99.3 /100 | #85 | Exceptional 76.4% |
| Immigrants | Iraq | 99.3 /100 | #86 | Exceptional 76.4% |
| Immigrants | Thailand | 99.3 /100 | #87 | Exceptional 76.4% |
| Spanish | 99.2 /100 | #88 | Exceptional 76.4% |
| Bulgarians | 99.2 /100 | #89 | Exceptional 76.4% |
| Immigrants | Burma/Myanmar | 99.1 /100 | #90 | Exceptional 76.3% |
| Sierra Leoneans | 99.0 /100 | #91 | Exceptional 76.3% |
Demographics Similar to Yakama by In Labor Force | Age 20-24
In terms of in labor force | age 20-24, the demographic groups most similar to Yakama are Cajun (75.1%, a difference of 0.010%), Immigrants from Croatia (75.1%, a difference of 0.010%), South African (75.0%, a difference of 0.010%), Mexican (75.1%, a difference of 0.020%), and Syrian (75.0%, a difference of 0.020%).
| Demographics | Rating | Rank | In Labor Force | Age 20-24 |
| Afghans | 63.5 /100 | #165 | Good 75.2% |
| Cambodians | 60.5 /100 | #166 | Good 75.2% |
| Immigrants | South Eastern Asia | 57.5 /100 | #167 | Average 75.1% |
| Immigrants | Western Africa | 56.7 /100 | #168 | Average 75.1% |
| Immigrants | Philippines | 55.8 /100 | #169 | Average 75.1% |
| Mexicans | 52.1 /100 | #170 | Average 75.1% |
| Cajuns | 51.1 /100 | #171 | Average 75.1% |
| Yakama | 50.8 /100 | #172 | Average 75.1% |
| Immigrants | Croatia | 50.2 /100 | #173 | Average 75.1% |
| South Africans | 50.0 /100 | #174 | Average 75.0% |
| Syrians | 49.5 /100 | #175 | Average 75.0% |
| Central Americans | 48.7 /100 | #176 | Average 75.0% |
| Immigrants | Mexico | 47.8 /100 | #177 | Average 75.0% |
| Immigrants | Central America | 45.0 /100 | #178 | Average 75.0% |
| Immigrants | Latvia | 44.1 /100 | #179 | Average 75.0% |