Immigrants from Senegal vs Immigrants from Western Europe In Labor Force | Age 25-29
COMPARE
Immigrants from Senegal
Immigrants from Western Europe
In Labor Force | Age 25-29
In Labor Force | Age 25-29 Comparison
Immigrants from Senegal
Immigrants from Western Europe
84.8%
IN LABOR FORCE | AGE 25-29
68.3/ 100
METRIC RATING
145th/ 347
METRIC RANK
84.7%
IN LABOR FORCE | AGE 25-29
50.4/ 100
METRIC RATING
172nd/ 347
METRIC RANK
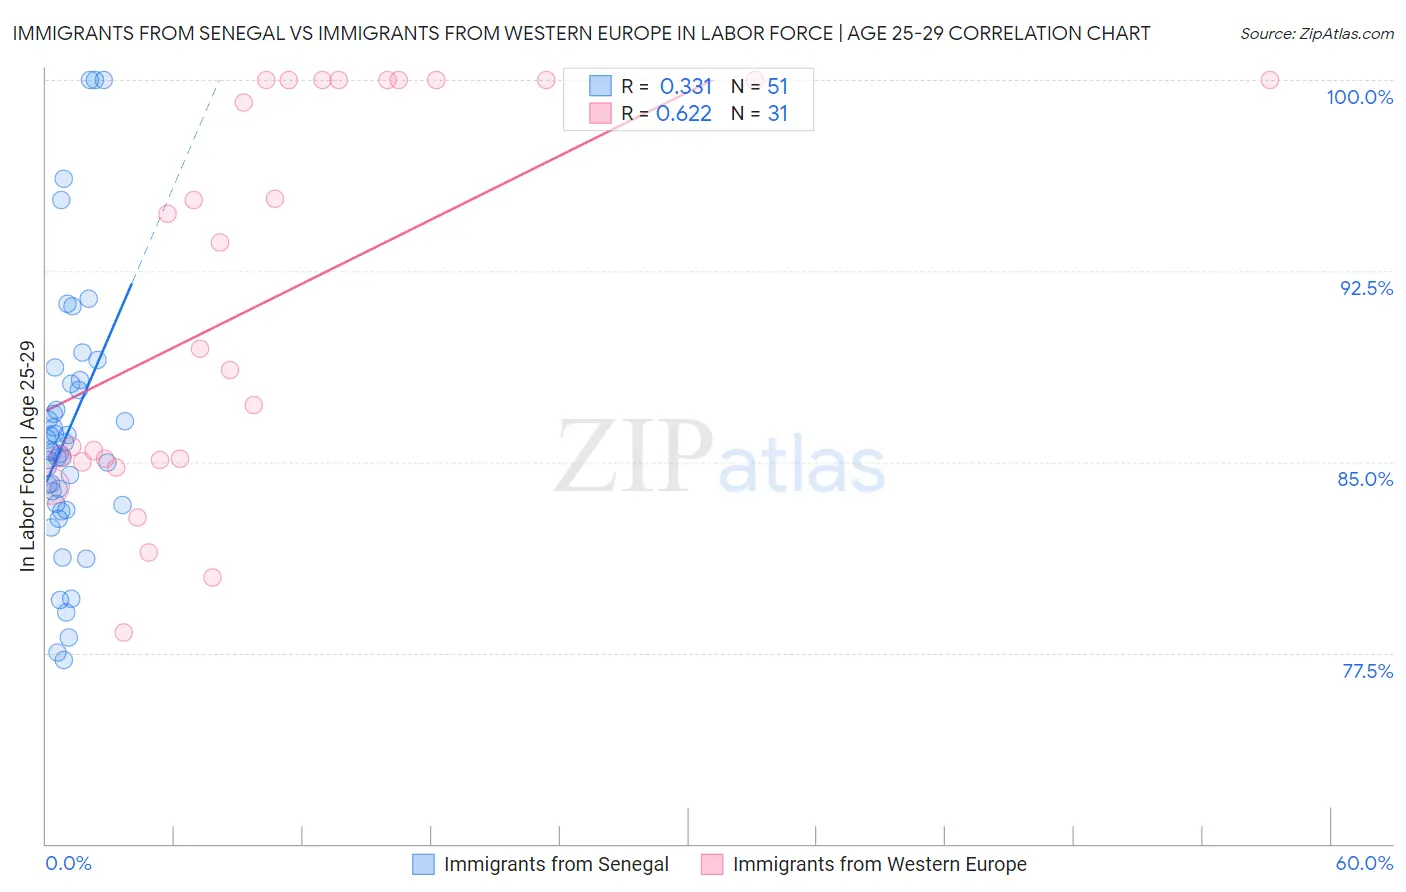
Immigrants from Senegal vs Immigrants from Western Europe In Labor Force | Age 25-29 Correlation Chart
The statistical analysis conducted on geographies consisting of 90,123,722 people shows a mild positive correlation between the proportion of Immigrants from Senegal and labor force participation rate among population between the ages 25 and 29 in the United States with a correlation coefficient (R) of 0.331 and weighted average of 84.8%. Similarly, the statistical analysis conducted on geographies consisting of 493,653,043 people shows a significant positive correlation between the proportion of Immigrants from Western Europe and labor force participation rate among population between the ages 25 and 29 in the United States with a correlation coefficient (R) of 0.622 and weighted average of 84.7%, a difference of 0.14%.
In Labor Force | Age 25-29 Correlation Summary
| Measurement | Immigrants from Senegal | Immigrants from Western Europe |
| Minimum | 77.2% | 78.3% |
| Maximum | 100.0% | 100.0% |
| Range | 22.8% | 21.7% |
| Mean | 86.1% | 91.4% |
| Median | 85.4% | 89.5% |
| Interquartile 25% (IQ1) | 83.3% | 85.1% |
| Interquartile 75% (IQ3) | 88.1% | 100.0% |
| Interquartile Range (IQR) | 4.8% | 14.9% |
| Standard Deviation (Sample) | 5.2% | 7.5% |
| Standard Deviation (Population) | 5.2% | 7.4% |
Similar Demographics by In Labor Force | Age 25-29
Demographics Similar to Immigrants from Senegal by In Labor Force | Age 25-29
In terms of in labor force | age 25-29, the demographic groups most similar to Immigrants from Senegal are Icelander (84.8%, a difference of 0.0%), Immigrants from Asia (84.8%, a difference of 0.0%), Pakistani (84.8%, a difference of 0.010%), Sri Lankan (84.8%, a difference of 0.010%), and Immigrants from Laos (84.8%, a difference of 0.010%).
| Demographics | Rating | Rank | In Labor Force | Age 25-29 |
| Armenians | 72.7 /100 | #138 | Good 84.8% |
| Immigrants | Eastern Asia | 72.6 /100 | #139 | Good 84.8% |
| Immigrants | North America | 72.1 /100 | #140 | Good 84.8% |
| Danes | 71.9 /100 | #141 | Good 84.8% |
| Pakistanis | 70.0 /100 | #142 | Good 84.8% |
| Sri Lankans | 69.2 /100 | #143 | Good 84.8% |
| Immigrants | Laos | 69.0 /100 | #144 | Good 84.8% |
| Immigrants | Senegal | 68.3 /100 | #145 | Good 84.8% |
| Icelanders | 68.2 /100 | #146 | Good 84.8% |
| Immigrants | Asia | 68.2 /100 | #147 | Good 84.8% |
| Immigrants | England | 65.2 /100 | #148 | Good 84.7% |
| Peruvians | 64.7 /100 | #149 | Good 84.7% |
| Swiss | 64.7 /100 | #150 | Good 84.7% |
| Colombians | 62.8 /100 | #151 | Good 84.7% |
| Immigrants | Pakistan | 62.7 /100 | #152 | Good 84.7% |
Demographics Similar to Immigrants from Western Europe by In Labor Force | Age 25-29
In terms of in labor force | age 25-29, the demographic groups most similar to Immigrants from Western Europe are Immigrants from Vietnam (84.7%, a difference of 0.0%), Assyrian/Chaldean/Syriac (84.7%, a difference of 0.0%), Palestinian (84.7%, a difference of 0.0%), Celtic (84.7%, a difference of 0.010%), and Tongan (84.7%, a difference of 0.010%).
| Demographics | Rating | Rank | In Labor Force | Age 25-29 |
| Immigrants | Burma/Myanmar | 57.4 /100 | #165 | Average 84.7% |
| Immigrants | Spain | 56.9 /100 | #166 | Average 84.7% |
| Indonesians | 56.5 /100 | #167 | Average 84.7% |
| South Americans | 54.9 /100 | #168 | Average 84.7% |
| Celtics | 52.5 /100 | #169 | Average 84.7% |
| Tongans | 52.4 /100 | #170 | Average 84.7% |
| Immigrants | Vietnam | 50.5 /100 | #171 | Average 84.7% |
| Immigrants | Western Europe | 50.4 /100 | #172 | Average 84.7% |
| Assyrians/Chaldeans/Syriacs | 50.2 /100 | #173 | Average 84.7% |
| Palestinians | 50.0 /100 | #174 | Average 84.7% |
| Hungarians | 47.8 /100 | #175 | Average 84.6% |
| Malaysians | 46.8 /100 | #176 | Average 84.6% |
| Immigrants | China | 45.7 /100 | #177 | Average 84.6% |
| Immigrants | Thailand | 45.2 /100 | #178 | Average 84.6% |
| Immigrants | Argentina | 44.0 /100 | #179 | Average 84.6% |