Slovene vs Immigrants from St. Vincent and the Grenadines In Labor Force | Age 25-29
COMPARE
Slovene
Immigrants from St. Vincent and the Grenadines
In Labor Force | Age 25-29
In Labor Force | Age 25-29 Comparison
Slovenes
Immigrants from St. Vincent and the Grenadines
86.4%
IN LABOR FORCE | AGE 25-29
100.0/ 100
METRIC RATING
6th/ 347
METRIC RANK
82.7%
IN LABOR FORCE | AGE 25-29
0.0/ 100
METRIC RATING
304th/ 347
METRIC RANK
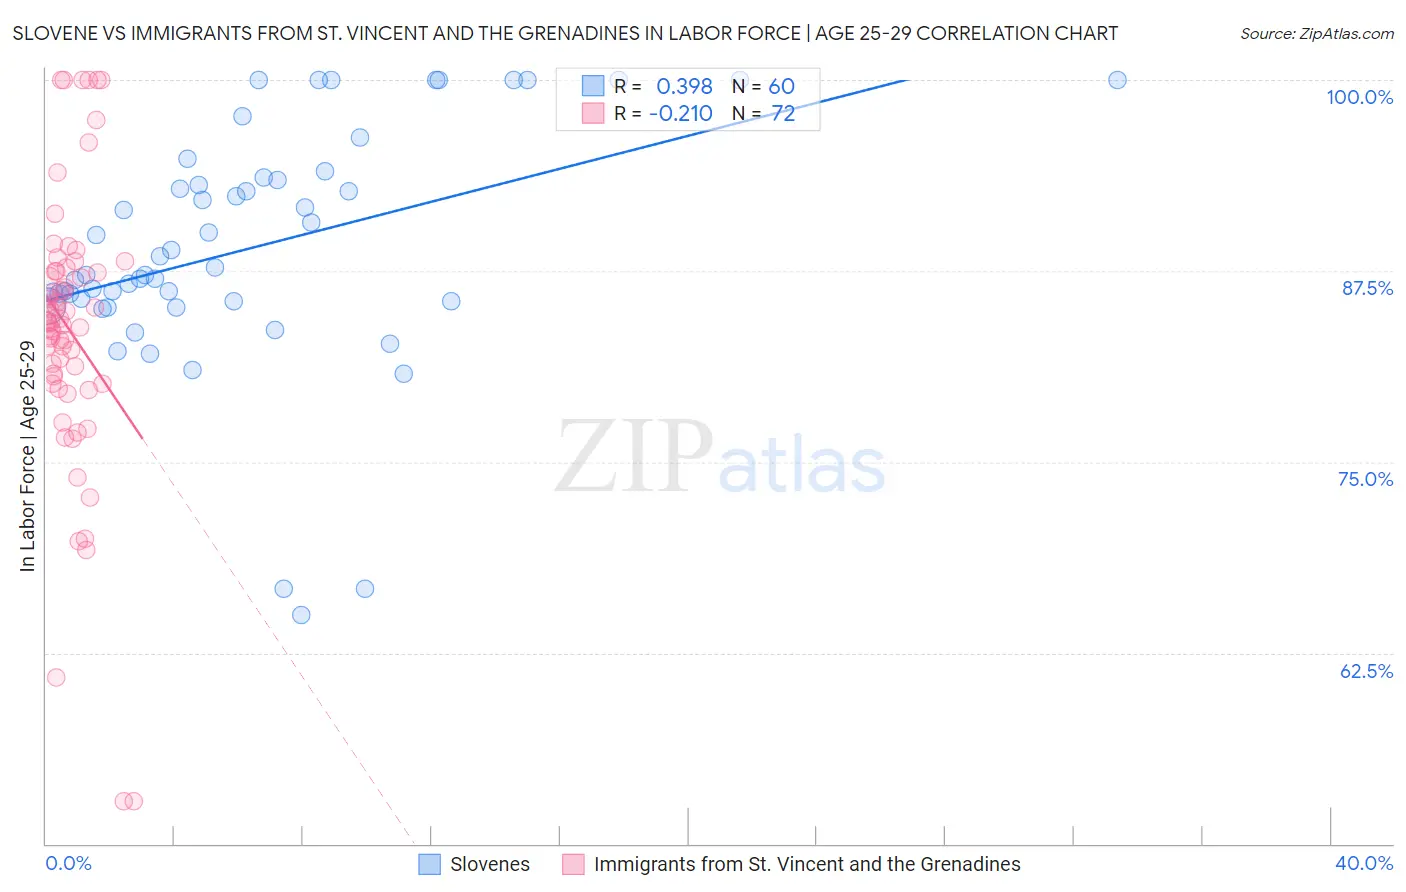
Slovene vs Immigrants from St. Vincent and the Grenadines In Labor Force | Age 25-29 Correlation Chart
The statistical analysis conducted on geographies consisting of 261,285,035 people shows a mild positive correlation between the proportion of Slovenes and labor force participation rate among population between the ages 25 and 29 in the United States with a correlation coefficient (R) of 0.398 and weighted average of 86.4%. Similarly, the statistical analysis conducted on geographies consisting of 56,189,778 people shows a weak negative correlation between the proportion of Immigrants from St. Vincent and the Grenadines and labor force participation rate among population between the ages 25 and 29 in the United States with a correlation coefficient (R) of -0.210 and weighted average of 82.7%, a difference of 4.4%.
In Labor Force | Age 25-29 Correlation Summary
| Measurement | Slovene | Immigrants from St. Vincent and the Grenadines |
| Minimum | 65.0% | 52.8% |
| Maximum | 100.0% | 100.0% |
| Range | 35.0% | 47.2% |
| Mean | 89.0% | 83.7% |
| Median | 87.5% | 84.1% |
| Interquartile 25% (IQ1) | 85.5% | 80.3% |
| Interquartile 75% (IQ3) | 93.5% | 87.5% |
| Interquartile Range (IQR) | 8.0% | 7.1% |
| Standard Deviation (Sample) | 7.8% | 9.1% |
| Standard Deviation (Population) | 7.8% | 9.1% |
Similar Demographics by In Labor Force | Age 25-29
Demographics Similar to Slovenes by In Labor Force | Age 25-29
In terms of in labor force | age 25-29, the demographic groups most similar to Slovenes are Immigrants from Bosnia and Herzegovina (86.3%, a difference of 0.12%), Immigrants from Cabo Verde (86.2%, a difference of 0.19%), Ethiopian (86.2%, a difference of 0.22%), Liberian (86.1%, a difference of 0.27%), and Immigrants from Ethiopia (86.1%, a difference of 0.27%).
| Demographics | Rating | Rank | In Labor Force | Age 25-29 |
| Tsimshian | 100.0 /100 | #1 | Exceptional 88.7% |
| Immigrants | Somalia | 100.0 /100 | #2 | Exceptional 87.1% |
| Somalis | 100.0 /100 | #3 | Exceptional 87.1% |
| Carpatho Rusyns | 100.0 /100 | #4 | Exceptional 87.0% |
| Luxembourgers | 100.0 /100 | #5 | Exceptional 86.9% |
| Slovenes | 100.0 /100 | #6 | Exceptional 86.4% |
| Immigrants | Bosnia and Herzegovina | 100.0 /100 | #7 | Exceptional 86.3% |
| Immigrants | Cabo Verde | 100.0 /100 | #8 | Exceptional 86.2% |
| Ethiopians | 100.0 /100 | #9 | Exceptional 86.2% |
| Liberians | 100.0 /100 | #10 | Exceptional 86.1% |
| Immigrants | Ethiopia | 100.0 /100 | #11 | Exceptional 86.1% |
| Immigrants | Lithuania | 100.0 /100 | #12 | Exceptional 86.1% |
| Norwegians | 100.0 /100 | #13 | Exceptional 86.1% |
| Latvians | 100.0 /100 | #14 | Exceptional 86.1% |
| Bolivians | 100.0 /100 | #15 | Exceptional 86.1% |
Demographics Similar to Immigrants from St. Vincent and the Grenadines by In Labor Force | Age 25-29
In terms of in labor force | age 25-29, the demographic groups most similar to Immigrants from St. Vincent and the Grenadines are Immigrants from Grenada (82.8%, a difference of 0.12%), Black/African American (82.6%, a difference of 0.12%), Blackfeet (82.6%, a difference of 0.13%), Immigrants from Belize (82.8%, a difference of 0.14%), and Vietnamese (82.8%, a difference of 0.17%).
| Demographics | Rating | Rank | In Labor Force | Age 25-29 |
| Potawatomi | 0.0 /100 | #297 | Tragic 82.9% |
| Native Hawaiians | 0.0 /100 | #298 | Tragic 82.9% |
| Fijians | 0.0 /100 | #299 | Tragic 82.9% |
| Spanish American Indians | 0.0 /100 | #300 | Tragic 82.9% |
| Vietnamese | 0.0 /100 | #301 | Tragic 82.8% |
| Immigrants | Belize | 0.0 /100 | #302 | Tragic 82.8% |
| Immigrants | Grenada | 0.0 /100 | #303 | Tragic 82.8% |
| Immigrants | St. Vincent and the Grenadines | 0.0 /100 | #304 | Tragic 82.7% |
| Blacks/African Americans | 0.0 /100 | #305 | Tragic 82.6% |
| Blackfeet | 0.0 /100 | #306 | Tragic 82.6% |
| Cajuns | 0.0 /100 | #307 | Tragic 82.5% |
| Central American Indians | 0.0 /100 | #308 | Tragic 82.4% |
| Immigrants | Central America | 0.0 /100 | #309 | Tragic 82.4% |
| Osage | 0.0 /100 | #310 | Tragic 82.3% |
| Alaskan Athabascans | 0.0 /100 | #311 | Tragic 82.3% |