Argentinean vs Crow In Labor Force | Age 35-44
COMPARE
Argentinean
Crow
In Labor Force | Age 35-44
In Labor Force | Age 35-44 Comparison
Argentineans
Crow
84.6%
IN LABOR FORCE | AGE 35-44
88.4/ 100
METRIC RATING
133rd/ 347
METRIC RANK
76.5%
IN LABOR FORCE | AGE 35-44
0.0/ 100
METRIC RATING
342nd/ 347
METRIC RANK
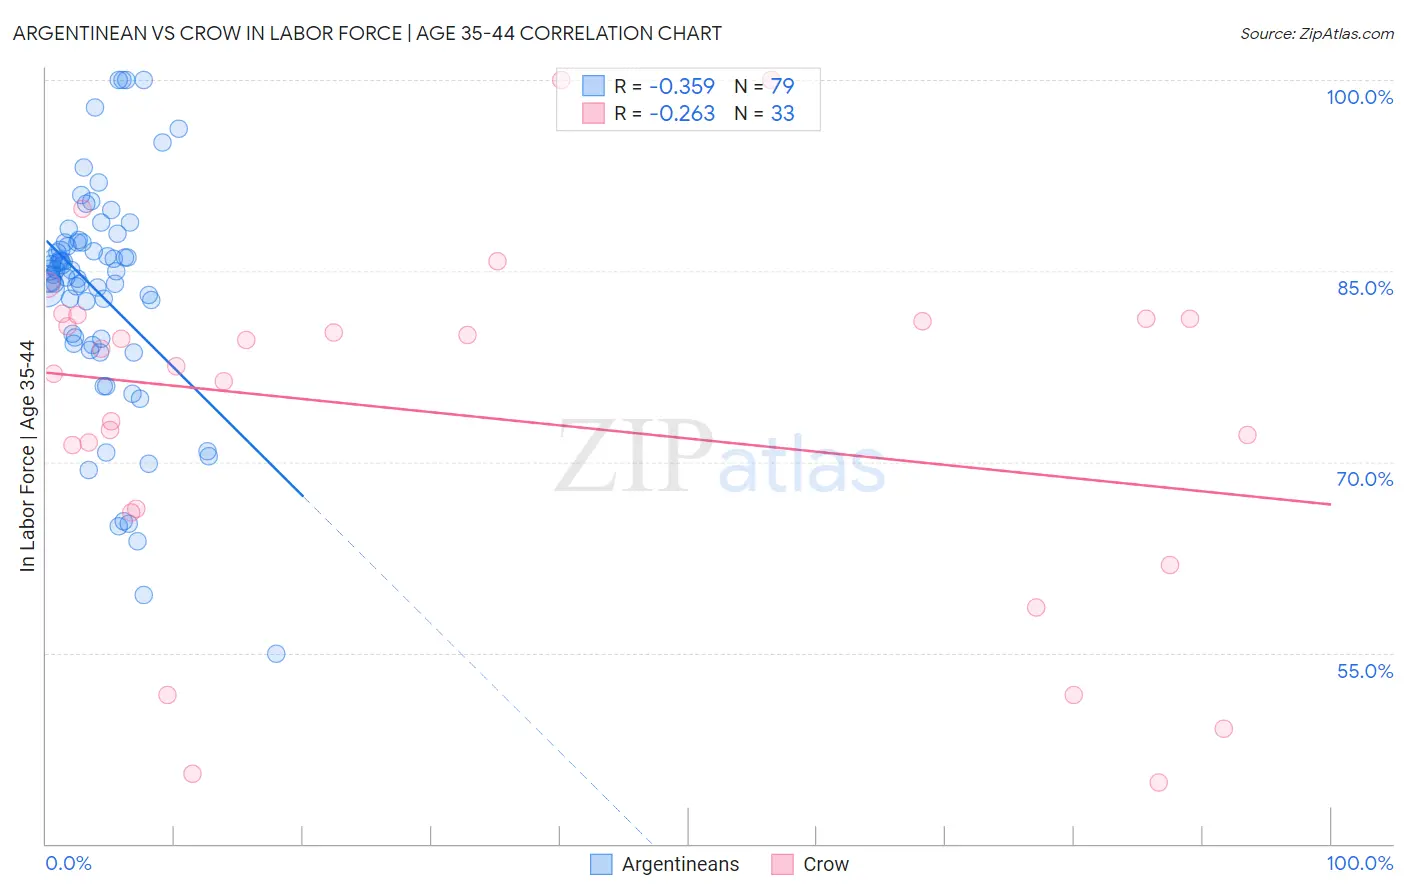
Argentinean vs Crow In Labor Force | Age 35-44 Correlation Chart
The statistical analysis conducted on geographies consisting of 297,032,479 people shows a mild negative correlation between the proportion of Argentineans and labor force participation rate among population between the ages 35 and 44 in the United States with a correlation coefficient (R) of -0.359 and weighted average of 84.6%. Similarly, the statistical analysis conducted on geographies consisting of 59,203,042 people shows a weak negative correlation between the proportion of Crow and labor force participation rate among population between the ages 35 and 44 in the United States with a correlation coefficient (R) of -0.263 and weighted average of 76.5%, a difference of 10.7%.
In Labor Force | Age 35-44 Correlation Summary
| Measurement | Argentinean | Crow |
| Minimum | 54.9% | 44.8% |
| Maximum | 100.0% | 100.0% |
| Range | 45.1% | 55.2% |
| Mean | 83.2% | 73.7% |
| Median | 85.0% | 77.5% |
| Interquartile 25% (IQ1) | 79.3% | 66.2% |
| Interquartile 75% (IQ3) | 87.2% | 81.2% |
| Interquartile Range (IQR) | 8.0% | 15.0% |
| Standard Deviation (Sample) | 9.0% | 13.9% |
| Standard Deviation (Population) | 8.9% | 13.7% |
Similar Demographics by In Labor Force | Age 35-44
Demographics Similar to Argentineans by In Labor Force | Age 35-44
In terms of in labor force | age 35-44, the demographic groups most similar to Argentineans are Immigrants from Korea (84.6%, a difference of 0.0%), Immigrants from Malaysia (84.6%, a difference of 0.010%), Palestinian (84.7%, a difference of 0.020%), Bhutanese (84.7%, a difference of 0.020%), and Immigrants from Scotland (84.7%, a difference of 0.020%).
| Demographics | Rating | Rank | In Labor Force | Age 35-44 |
| Asians | 90.6 /100 | #126 | Exceptional 84.7% |
| Immigrants | Spain | 90.6 /100 | #127 | Exceptional 84.7% |
| Immigrants | Ghana | 90.4 /100 | #128 | Exceptional 84.7% |
| Palestinians | 89.7 /100 | #129 | Excellent 84.7% |
| Bhutanese | 89.7 /100 | #130 | Excellent 84.7% |
| Immigrants | Scotland | 89.6 /100 | #131 | Excellent 84.7% |
| Austrians | 89.4 /100 | #132 | Excellent 84.7% |
| Argentineans | 88.4 /100 | #133 | Excellent 84.6% |
| Immigrants | Korea | 88.2 /100 | #134 | Excellent 84.6% |
| Immigrants | Malaysia | 87.5 /100 | #135 | Excellent 84.6% |
| Afghans | 86.3 /100 | #136 | Excellent 84.6% |
| Immigrants | Chile | 84.6 /100 | #137 | Excellent 84.6% |
| Czechoslovakians | 82.6 /100 | #138 | Excellent 84.6% |
| Immigrants | Zaire | 82.5 /100 | #139 | Excellent 84.6% |
| Immigrants | Japan | 81.4 /100 | #140 | Excellent 84.6% |
Demographics Similar to Crow by In Labor Force | Age 35-44
In terms of in labor force | age 35-44, the demographic groups most similar to Crow are Immigrants from Yemen (76.3%, a difference of 0.24%), Hopi (77.0%, a difference of 0.64%), Lumbee (77.0%, a difference of 0.69%), Yup'ik (77.3%, a difference of 1.0%), and Pueblo (77.4%, a difference of 1.1%).
| Demographics | Rating | Rank | In Labor Force | Age 35-44 |
| Kiowa | 0.0 /100 | #333 | Tragic 79.2% |
| Yakama | 0.0 /100 | #334 | Tragic 79.0% |
| Natives/Alaskans | 0.0 /100 | #335 | Tragic 78.9% |
| Arapaho | 0.0 /100 | #336 | Tragic 78.1% |
| Apache | 0.0 /100 | #337 | Tragic 77.9% |
| Pueblo | 0.0 /100 | #338 | Tragic 77.4% |
| Yup'ik | 0.0 /100 | #339 | Tragic 77.3% |
| Lumbee | 0.0 /100 | #340 | Tragic 77.0% |
| Hopi | 0.0 /100 | #341 | Tragic 77.0% |
| Crow | 0.0 /100 | #342 | Tragic 76.5% |
| Immigrants | Yemen | 0.0 /100 | #343 | Tragic 76.3% |
| Pima | 0.0 /100 | #344 | Tragic 74.8% |
| Yuman | 0.0 /100 | #345 | Tragic 74.7% |
| Tohono O'odham | 0.0 /100 | #346 | Tragic 74.1% |
| Navajo | 0.0 /100 | #347 | Tragic 73.8% |