Immigrants from Italy vs Immigrants from Uruguay In Labor Force | Age 35-44
COMPARE
Immigrants from Italy
Immigrants from Uruguay
In Labor Force | Age 35-44
In Labor Force | Age 35-44 Comparison
Immigrants from Italy
Immigrants from Uruguay
85.0%
IN LABOR FORCE | AGE 35-44
99.1/ 100
METRIC RATING
67th/ 347
METRIC RANK
84.6%
IN LABOR FORCE | AGE 35-44
80.1/ 100
METRIC RATING
142nd/ 347
METRIC RANK
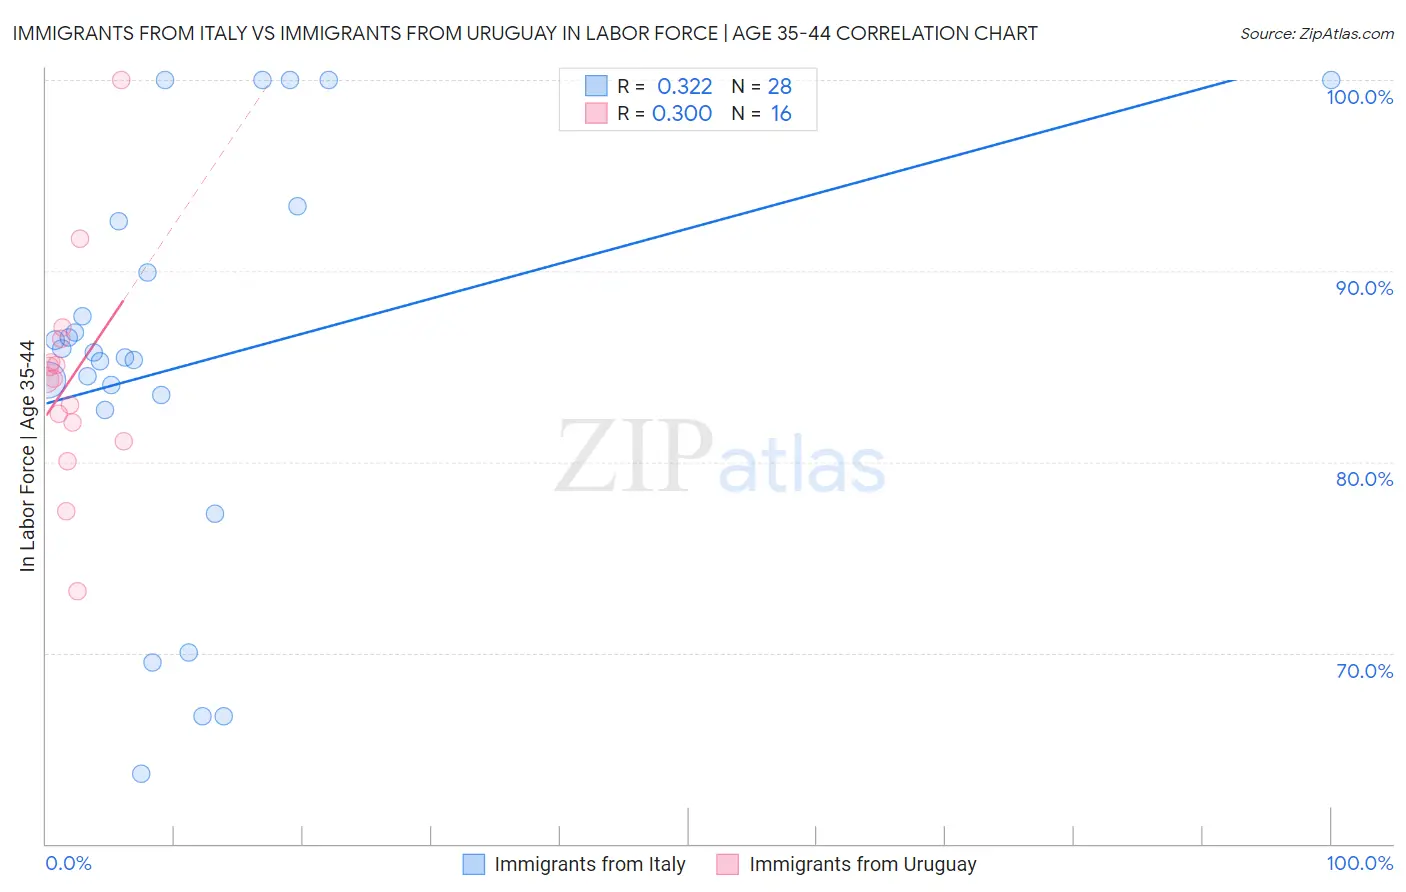
Immigrants from Italy vs Immigrants from Uruguay In Labor Force | Age 35-44 Correlation Chart
The statistical analysis conducted on geographies consisting of 324,156,768 people shows a mild positive correlation between the proportion of Immigrants from Italy and labor force participation rate among population between the ages 35 and 44 in the United States with a correlation coefficient (R) of 0.322 and weighted average of 85.0%. Similarly, the statistical analysis conducted on geographies consisting of 133,247,562 people shows a weak positive correlation between the proportion of Immigrants from Uruguay and labor force participation rate among population between the ages 35 and 44 in the United States with a correlation coefficient (R) of 0.300 and weighted average of 84.6%, a difference of 0.54%.
In Labor Force | Age 35-44 Correlation Summary
| Measurement | Immigrants from Italy | Immigrants from Uruguay |
| Minimum | 63.7% | 73.2% |
| Maximum | 100.0% | 100.0% |
| Range | 36.3% | 26.8% |
| Mean | 85.1% | 84.3% |
| Median | 85.6% | 84.3% |
| Interquartile 25% (IQ1) | 83.1% | 81.6% |
| Interquartile 75% (IQ3) | 91.2% | 85.8% |
| Interquartile Range (IQR) | 8.1% | 4.3% |
| Standard Deviation (Sample) | 10.5% | 5.9% |
| Standard Deviation (Population) | 10.3% | 5.7% |
Similar Demographics by In Labor Force | Age 35-44
Demographics Similar to Immigrants from Italy by In Labor Force | Age 35-44
In terms of in labor force | age 35-44, the demographic groups most similar to Immigrants from Italy are Italian (85.0%, a difference of 0.0%), Immigrants from Brazil (85.0%, a difference of 0.010%), Immigrants from Haiti (85.0%, a difference of 0.010%), Sudanese (85.0%, a difference of 0.010%), and Swedish (85.0%, a difference of 0.020%).
| Demographics | Rating | Rank | In Labor Force | Age 35-44 |
| Albanians | 99.4 /100 | #60 | Exceptional 85.1% |
| Immigrants | Latvia | 99.3 /100 | #61 | Exceptional 85.0% |
| Immigrants | Moldova | 99.3 /100 | #62 | Exceptional 85.0% |
| Immigrants | Uganda | 99.3 /100 | #63 | Exceptional 85.0% |
| Swedes | 99.2 /100 | #64 | Exceptional 85.0% |
| Immigrants | Brazil | 99.2 /100 | #65 | Exceptional 85.0% |
| Immigrants | Haiti | 99.1 /100 | #66 | Exceptional 85.0% |
| Immigrants | Italy | 99.1 /100 | #67 | Exceptional 85.0% |
| Italians | 99.1 /100 | #68 | Exceptional 85.0% |
| Sudanese | 99.0 /100 | #69 | Exceptional 85.0% |
| Brazilians | 99.0 /100 | #70 | Exceptional 85.0% |
| Russians | 99.0 /100 | #71 | Exceptional 85.0% |
| Immigrants | Singapore | 98.9 /100 | #72 | Exceptional 85.0% |
| Immigrants | Sri Lanka | 98.9 /100 | #73 | Exceptional 85.0% |
| Colombians | 98.8 /100 | #74 | Exceptional 85.0% |
Demographics Similar to Immigrants from Uruguay by In Labor Force | Age 35-44
In terms of in labor force | age 35-44, the demographic groups most similar to Immigrants from Uruguay are Immigrants from Ukraine (84.6%, a difference of 0.0%), Immigrants from Japan (84.6%, a difference of 0.010%), Immigrants from Belgium (84.6%, a difference of 0.010%), Immigrants from Jamaica (84.6%, a difference of 0.010%), and Immigrants from Saudi Arabia (84.6%, a difference of 0.010%).
| Demographics | Rating | Rank | In Labor Force | Age 35-44 |
| Immigrants | Malaysia | 87.5 /100 | #135 | Excellent 84.6% |
| Afghans | 86.3 /100 | #136 | Excellent 84.6% |
| Immigrants | Chile | 84.6 /100 | #137 | Excellent 84.6% |
| Czechoslovakians | 82.6 /100 | #138 | Excellent 84.6% |
| Immigrants | Zaire | 82.5 /100 | #139 | Excellent 84.6% |
| Immigrants | Japan | 81.4 /100 | #140 | Excellent 84.6% |
| Immigrants | Belgium | 80.8 /100 | #141 | Excellent 84.6% |
| Immigrants | Uruguay | 80.1 /100 | #142 | Excellent 84.6% |
| Immigrants | Ukraine | 79.7 /100 | #143 | Good 84.6% |
| Immigrants | Jamaica | 79.4 /100 | #144 | Good 84.6% |
| Immigrants | Saudi Arabia | 79.4 /100 | #145 | Good 84.6% |
| Immigrants | Asia | 78.7 /100 | #146 | Good 84.5% |
| Immigrants | Netherlands | 76.6 /100 | #147 | Good 84.5% |
| South American Indians | 73.6 /100 | #148 | Good 84.5% |
| Okinawans | 73.5 /100 | #149 | Good 84.5% |