Arapaho vs Immigrants from Croatia In Labor Force | Age 16-19
COMPARE
Arapaho
Immigrants from Croatia
In Labor Force | Age 16-19
In Labor Force | Age 16-19 Comparison
Arapaho
Immigrants from Croatia
37.3%
IN LABOR FORCE | AGE 16-19
81.8/ 100
METRIC RATING
153rd/ 347
METRIC RANK
36.1%
IN LABOR FORCE | AGE 16-19
27.5/ 100
METRIC RATING
191st/ 347
METRIC RANK
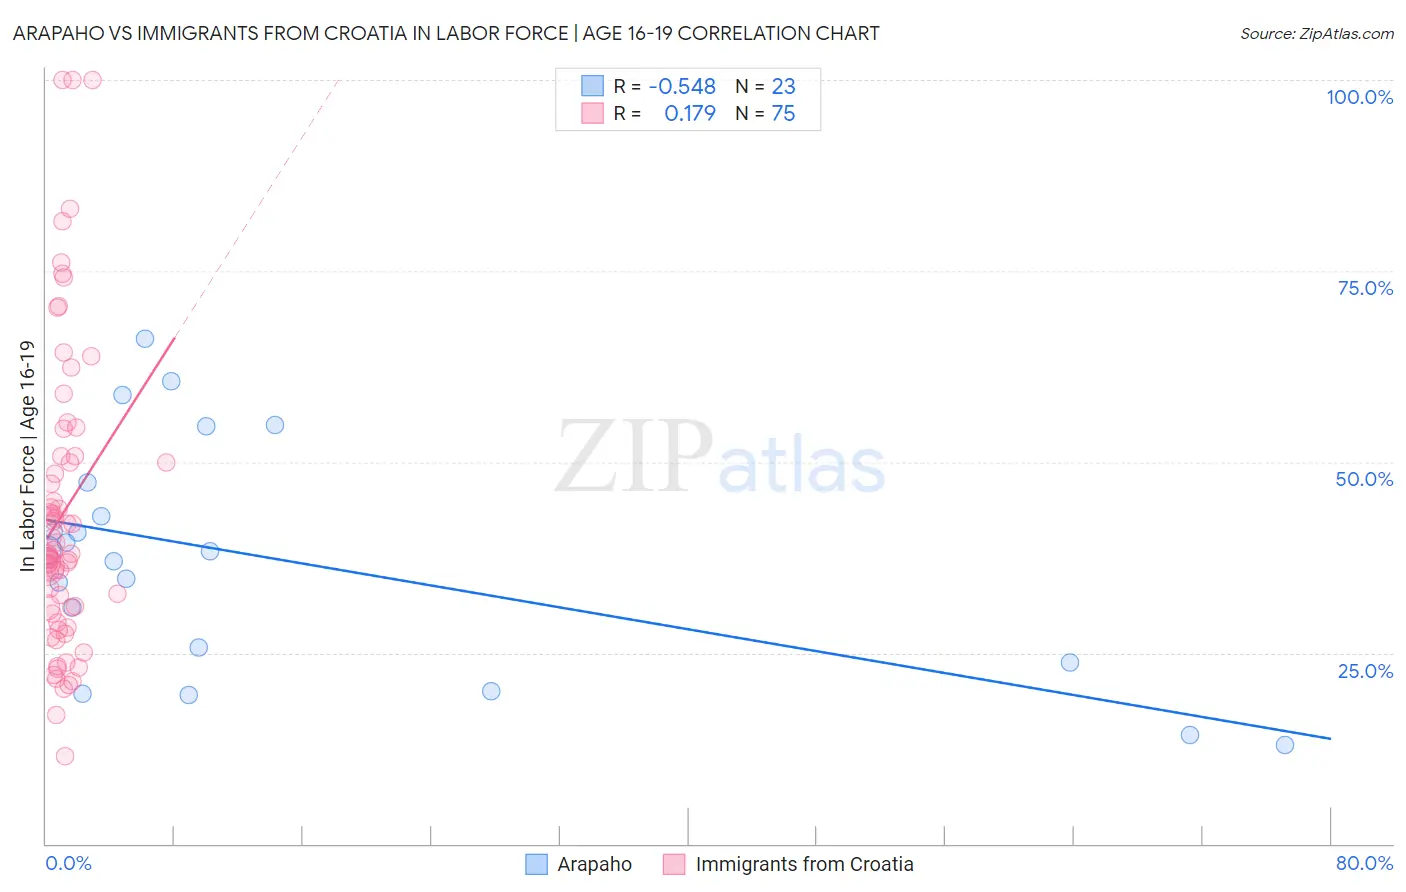
Arapaho vs Immigrants from Croatia In Labor Force | Age 16-19 Correlation Chart
The statistical analysis conducted on geographies consisting of 29,768,466 people shows a substantial negative correlation between the proportion of Arapaho and labor force participation rate among population between the ages 16 and 19 in the United States with a correlation coefficient (R) of -0.548 and weighted average of 37.3%. Similarly, the statistical analysis conducted on geographies consisting of 132,497,839 people shows a poor positive correlation between the proportion of Immigrants from Croatia and labor force participation rate among population between the ages 16 and 19 in the United States with a correlation coefficient (R) of 0.179 and weighted average of 36.1%, a difference of 3.2%.
In Labor Force | Age 16-19 Correlation Summary
| Measurement | Arapaho | Immigrants from Croatia |
| Minimum | 13.0% | 11.5% |
| Maximum | 66.1% | 100.0% |
| Range | 53.1% | 88.5% |
| Mean | 37.2% | 43.3% |
| Median | 38.3% | 37.8% |
| Interquartile 25% (IQ1) | 23.7% | 30.1% |
| Interquartile 75% (IQ3) | 47.3% | 50.7% |
| Interquartile Range (IQR) | 23.6% | 20.6% |
| Standard Deviation (Sample) | 15.1% | 19.6% |
| Standard Deviation (Population) | 14.8% | 19.5% |
Similar Demographics by In Labor Force | Age 16-19
Demographics Similar to Arapaho by In Labor Force | Age 16-19
In terms of in labor force | age 16-19, the demographic groups most similar to Arapaho are Immigrants from Bulgaria (37.3%, a difference of 0.020%), Immigrants from Lithuania (37.2%, a difference of 0.090%), Kiowa (37.2%, a difference of 0.12%), Immigrants from Sierra Leone (37.3%, a difference of 0.15%), and Immigrants from Poland (37.3%, a difference of 0.23%).
| Demographics | Rating | Rank | In Labor Force | Age 16-19 |
| Immigrants | Western Europe | 88.9 /100 | #146 | Excellent 37.5% |
| Brazilians | 88.7 /100 | #147 | Excellent 37.5% |
| Romanians | 87.3 /100 | #148 | Excellent 37.5% |
| Native Hawaiians | 85.0 /100 | #149 | Excellent 37.4% |
| Tsimshian | 84.7 /100 | #150 | Excellent 37.4% |
| Immigrants | Poland | 84.4 /100 | #151 | Excellent 37.3% |
| Immigrants | Sierra Leone | 83.6 /100 | #152 | Excellent 37.3% |
| Arapaho | 81.8 /100 | #153 | Excellent 37.3% |
| Immigrants | Bulgaria | 81.6 /100 | #154 | Excellent 37.3% |
| Immigrants | Lithuania | 80.7 /100 | #155 | Excellent 37.2% |
| Kiowa | 80.4 /100 | #156 | Excellent 37.2% |
| Immigrants | Brazil | 76.5 /100 | #157 | Good 37.1% |
| Ute | 75.7 /100 | #158 | Good 37.1% |
| Yaqui | 74.4 /100 | #159 | Good 37.1% |
| Immigrants | Saudi Arabia | 73.9 /100 | #160 | Good 37.0% |
Demographics Similar to Immigrants from Croatia by In Labor Force | Age 16-19
In terms of in labor force | age 16-19, the demographic groups most similar to Immigrants from Croatia are Panamanian (36.1%, a difference of 0.070%), Immigrants from Hungary (36.2%, a difference of 0.080%), Afghan (36.1%, a difference of 0.12%), Immigrants from Denmark (36.1%, a difference of 0.17%), and Nigerian (36.1%, a difference of 0.19%).
| Demographics | Rating | Rank | In Labor Force | Age 16-19 |
| Costa Ricans | 36.1 /100 | #184 | Fair 36.3% |
| Bhutanese | 35.3 /100 | #185 | Fair 36.3% |
| Immigrants | Romania | 34.0 /100 | #186 | Fair 36.3% |
| Immigrants | Afghanistan | 34.0 /100 | #187 | Fair 36.3% |
| Immigrants | Europe | 31.8 /100 | #188 | Fair 36.2% |
| Immigrants | Hungary | 28.8 /100 | #189 | Fair 36.2% |
| Panamanians | 28.6 /100 | #190 | Fair 36.1% |
| Immigrants | Croatia | 27.5 /100 | #191 | Fair 36.1% |
| Afghans | 25.7 /100 | #192 | Fair 36.1% |
| Immigrants | Denmark | 25.0 /100 | #193 | Fair 36.1% |
| Nigerians | 24.6 /100 | #194 | Fair 36.1% |
| Bolivians | 23.3 /100 | #195 | Fair 36.0% |
| Mexican American Indians | 21.1 /100 | #196 | Fair 36.0% |
| Immigrants | Serbia | 21.0 /100 | #197 | Fair 36.0% |
| Immigrants | Northern Africa | 19.9 /100 | #198 | Poor 35.9% |