Alsatian vs Immigrants from Panama In Labor Force | Age 45-54
COMPARE
Alsatian
Immigrants from Panama
In Labor Force | Age 45-54
In Labor Force | Age 45-54 Comparison
Alsatians
Immigrants from Panama
81.3%
IN LABOR FORCE | AGE 45-54
0.0/ 100
METRIC RATING
269th/ 347
METRIC RANK
82.2%
IN LABOR FORCE | AGE 45-54
5.6/ 100
METRIC RATING
214th/ 347
METRIC RANK
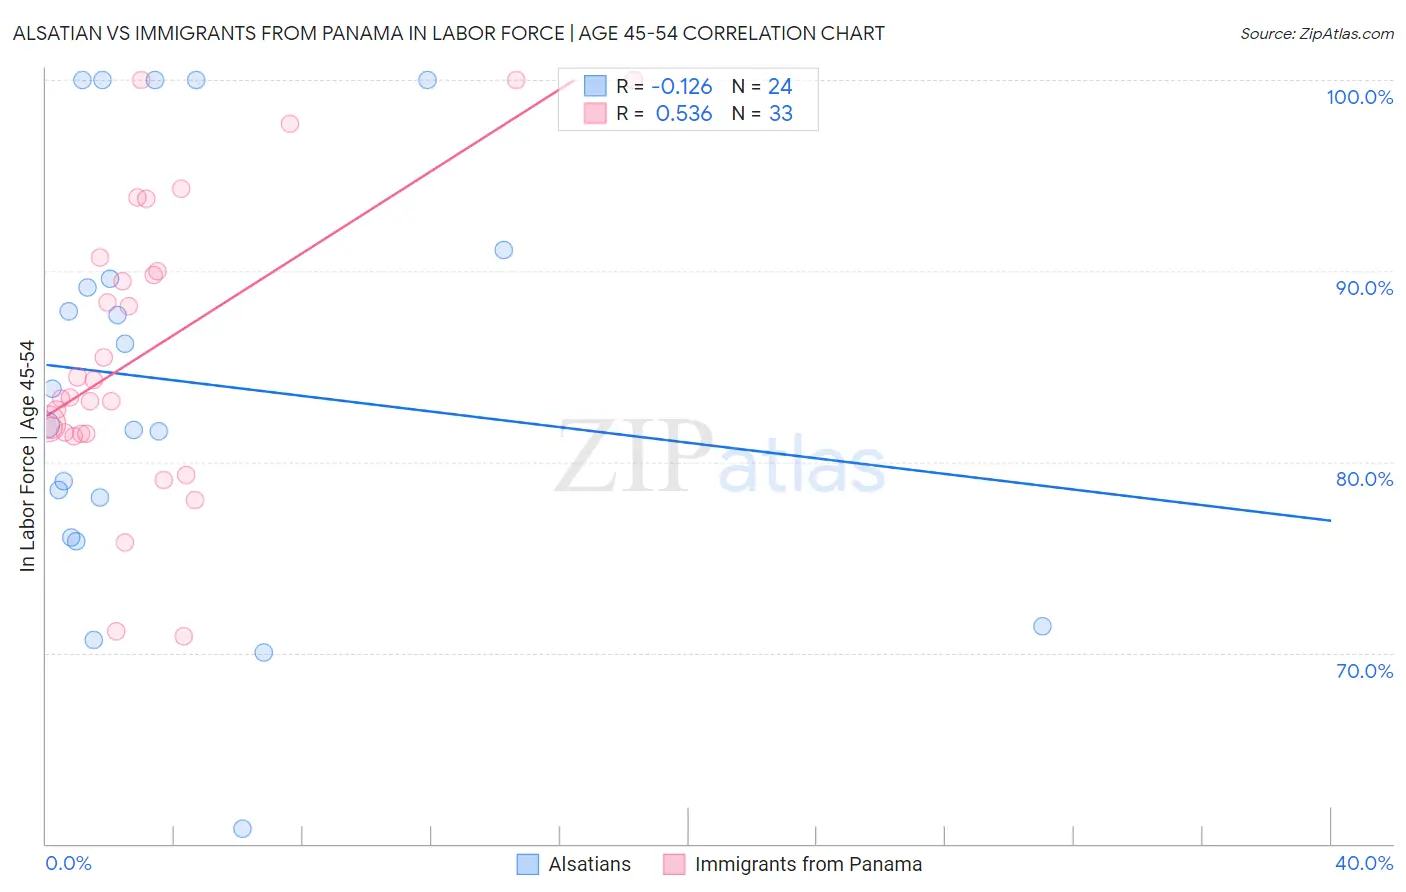
Alsatian vs Immigrants from Panama In Labor Force | Age 45-54 Correlation Chart
The statistical analysis conducted on geographies consisting of 82,679,176 people shows a poor negative correlation between the proportion of Alsatians and labor force participation rate among population between the ages 45 and 54 in the United States with a correlation coefficient (R) of -0.126 and weighted average of 81.3%. Similarly, the statistical analysis conducted on geographies consisting of 221,155,695 people shows a substantial positive correlation between the proportion of Immigrants from Panama and labor force participation rate among population between the ages 45 and 54 in the United States with a correlation coefficient (R) of 0.536 and weighted average of 82.2%, a difference of 1.1%.
In Labor Force | Age 45-54 Correlation Summary
| Measurement | Alsatian | Immigrants from Panama |
| Minimum | 60.8% | 70.9% |
| Maximum | 100.0% | 100.0% |
| Range | 39.2% | 29.1% |
| Mean | 84.2% | 85.8% |
| Median | 82.9% | 83.4% |
| Interquartile 25% (IQ1) | 77.1% | 81.5% |
| Interquartile 75% (IQ3) | 90.3% | 90.3% |
| Interquartile Range (IQR) | 13.2% | 8.9% |
| Standard Deviation (Sample) | 10.9% | 7.6% |
| Standard Deviation (Population) | 10.7% | 7.5% |
Similar Demographics by In Labor Force | Age 45-54
Demographics Similar to Alsatians by In Labor Force | Age 45-54
In terms of in labor force | age 45-54, the demographic groups most similar to Alsatians are Immigrants from Honduras (81.4%, a difference of 0.020%), Bangladeshi (81.3%, a difference of 0.030%), West Indian (81.4%, a difference of 0.040%), Immigrants from Barbados (81.3%, a difference of 0.040%), and Spanish (81.3%, a difference of 0.040%).
| Demographics | Rating | Rank | In Labor Force | Age 45-54 |
| Immigrants | Guyana | 0.1 /100 | #262 | Tragic 81.5% |
| Indonesians | 0.1 /100 | #263 | Tragic 81.5% |
| Immigrants | West Indies | 0.1 /100 | #264 | Tragic 81.5% |
| Hondurans | 0.1 /100 | #265 | Tragic 81.4% |
| Immigrants | St. Vincent and the Grenadines | 0.1 /100 | #266 | Tragic 81.4% |
| West Indians | 0.1 /100 | #267 | Tragic 81.4% |
| Immigrants | Honduras | 0.0 /100 | #268 | Tragic 81.4% |
| Alsatians | 0.0 /100 | #269 | Tragic 81.3% |
| Bangladeshis | 0.0 /100 | #270 | Tragic 81.3% |
| Immigrants | Barbados | 0.0 /100 | #271 | Tragic 81.3% |
| Spanish | 0.0 /100 | #272 | Tragic 81.3% |
| Chippewa | 0.0 /100 | #273 | Tragic 81.3% |
| British West Indians | 0.0 /100 | #274 | Tragic 81.2% |
| Immigrants | Nonimmigrants | 0.0 /100 | #275 | Tragic 81.2% |
| U.S. Virgin Islanders | 0.0 /100 | #276 | Tragic 81.2% |
Demographics Similar to Immigrants from Panama by In Labor Force | Age 45-54
In terms of in labor force | age 45-54, the demographic groups most similar to Immigrants from Panama are Iraqi (82.2%, a difference of 0.0%), Immigrants from Uzbekistan (82.3%, a difference of 0.010%), Scottish (82.2%, a difference of 0.010%), Ecuadorian (82.3%, a difference of 0.030%), and Immigrants from Syria (82.3%, a difference of 0.040%).
| Demographics | Rating | Rank | In Labor Force | Age 45-54 |
| Immigrants | Cabo Verde | 8.6 /100 | #207 | Tragic 82.3% |
| Native Hawaiians | 8.5 /100 | #208 | Tragic 82.3% |
| Immigrants | Lebanon | 7.4 /100 | #209 | Tragic 82.3% |
| Immigrants | Bahamas | 7.1 /100 | #210 | Tragic 82.3% |
| Immigrants | Syria | 6.6 /100 | #211 | Tragic 82.3% |
| Ecuadorians | 6.3 /100 | #212 | Tragic 82.3% |
| Immigrants | Uzbekistan | 5.8 /100 | #213 | Tragic 82.3% |
| Immigrants | Panama | 5.6 /100 | #214 | Tragic 82.2% |
| Iraqis | 5.6 /100 | #215 | Tragic 82.2% |
| Scottish | 5.3 /100 | #216 | Tragic 82.2% |
| Portuguese | 4.7 /100 | #217 | Tragic 82.2% |
| English | 4.4 /100 | #218 | Tragic 82.2% |
| French | 4.1 /100 | #219 | Tragic 82.2% |
| Bahamians | 3.6 /100 | #220 | Tragic 82.2% |
| Panamanians | 3.5 /100 | #221 | Tragic 82.2% |