Alsatian vs Hopi In Labor Force | Age 35-44
COMPARE
Alsatian
Hopi
In Labor Force | Age 35-44
In Labor Force | Age 35-44 Comparison
Alsatians
Hopi
84.4%
IN LABOR FORCE | AGE 35-44
55.2/ 100
METRIC RATING
166th/ 347
METRIC RANK
77.0%
IN LABOR FORCE | AGE 35-44
0.0/ 100
METRIC RATING
341st/ 347
METRIC RANK
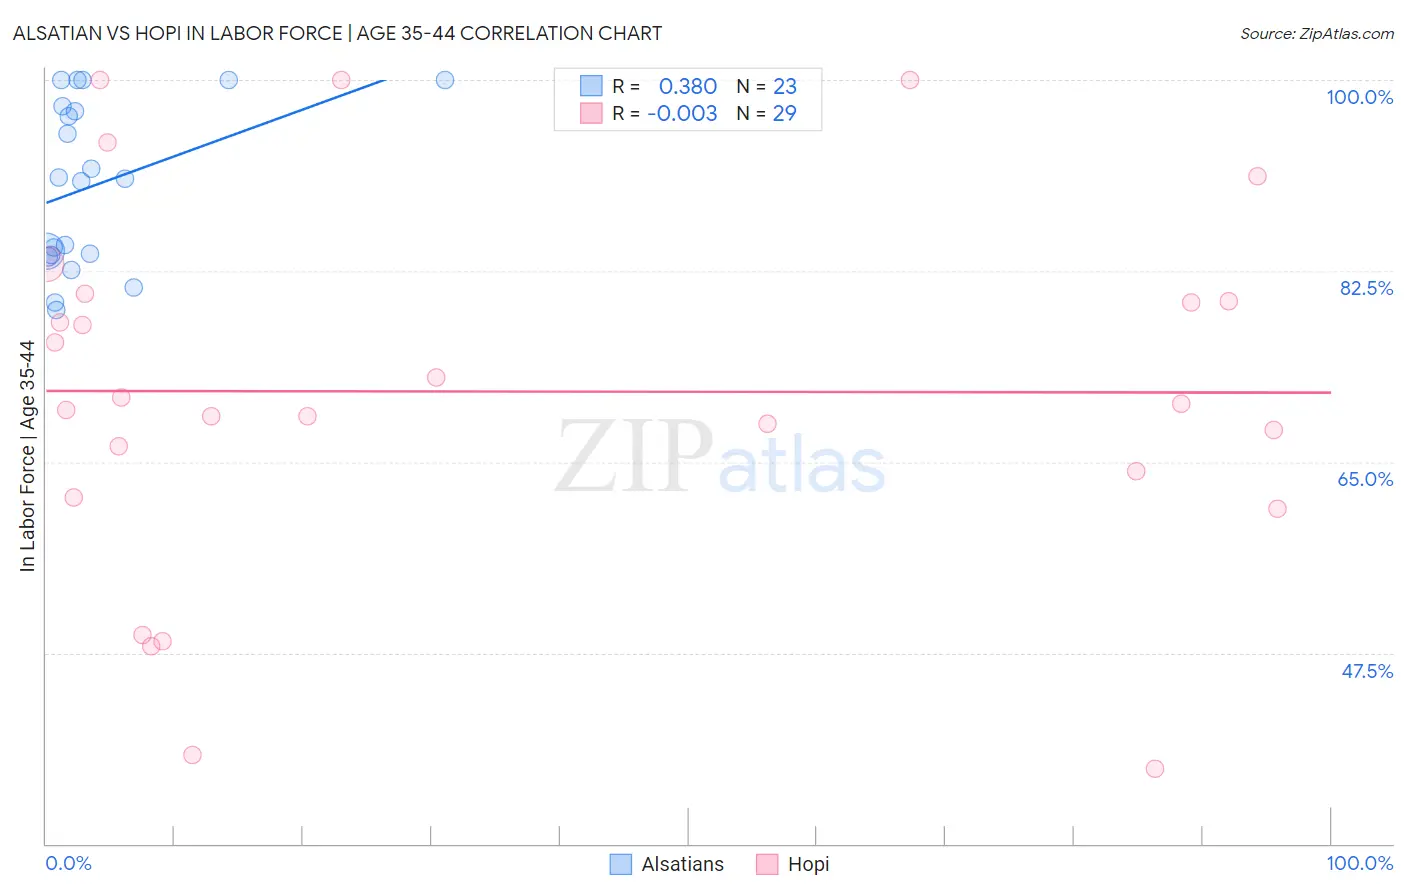
Alsatian vs Hopi In Labor Force | Age 35-44 Correlation Chart
The statistical analysis conducted on geographies consisting of 82,678,421 people shows a mild positive correlation between the proportion of Alsatians and labor force participation rate among population between the ages 35 and 44 in the United States with a correlation coefficient (R) of 0.380 and weighted average of 84.4%. Similarly, the statistical analysis conducted on geographies consisting of 74,733,485 people shows no correlation between the proportion of Hopi and labor force participation rate among population between the ages 35 and 44 in the United States with a correlation coefficient (R) of -0.003 and weighted average of 77.0%, a difference of 9.7%.
In Labor Force | Age 35-44 Correlation Summary
| Measurement | Alsatian | Hopi |
| Minimum | 78.9% | 36.9% |
| Maximum | 100.0% | 100.0% |
| Range | 21.1% | 63.1% |
| Mean | 90.4% | 71.4% |
| Median | 91.0% | 70.3% |
| Interquartile 25% (IQ1) | 83.9% | 62.9% |
| Interquartile 75% (IQ3) | 97.6% | 80.1% |
| Interquartile Range (IQR) | 13.7% | 17.1% |
| Standard Deviation (Sample) | 7.5% | 16.9% |
| Standard Deviation (Population) | 7.4% | 16.6% |
Similar Demographics by In Labor Force | Age 35-44
Demographics Similar to Alsatians by In Labor Force | Age 35-44
In terms of in labor force | age 35-44, the demographic groups most similar to Alsatians are Immigrants from Portugal (84.4%, a difference of 0.0%), Irish (84.4%, a difference of 0.010%), Nigerian (84.4%, a difference of 0.020%), Venezuelan (84.4%, a difference of 0.020%), and Immigrants from Afghanistan (84.4%, a difference of 0.020%).
| Demographics | Rating | Rank | In Labor Force | Age 35-44 |
| Immigrants | Senegal | 60.4 /100 | #159 | Good 84.4% |
| Immigrants | Kazakhstan | 60.4 /100 | #160 | Good 84.4% |
| Immigrants | Venezuela | 60.0 /100 | #161 | Good 84.4% |
| Immigrants | Hungary | 59.4 /100 | #162 | Average 84.4% |
| Aleuts | 59.1 /100 | #163 | Average 84.4% |
| Nigerians | 58.9 /100 | #164 | Average 84.4% |
| Venezuelans | 58.1 /100 | #165 | Average 84.4% |
| Alsatians | 55.2 /100 | #166 | Average 84.4% |
| Immigrants | Portugal | 55.2 /100 | #167 | Average 84.4% |
| Irish | 53.1 /100 | #168 | Average 84.4% |
| Immigrants | Afghanistan | 52.7 /100 | #169 | Average 84.4% |
| Immigrants | Jordan | 52.5 /100 | #170 | Average 84.4% |
| Jordanians | 51.7 /100 | #171 | Average 84.4% |
| Scandinavians | 51.2 /100 | #172 | Average 84.4% |
| Immigrants | Trinidad and Tobago | 50.7 /100 | #173 | Average 84.4% |
Demographics Similar to Hopi by In Labor Force | Age 35-44
In terms of in labor force | age 35-44, the demographic groups most similar to Hopi are Lumbee (77.0%, a difference of 0.050%), Yup'ik (77.3%, a difference of 0.40%), Pueblo (77.4%, a difference of 0.50%), Crow (76.5%, a difference of 0.64%), and Immigrants from Yemen (76.3%, a difference of 0.88%).
| Demographics | Rating | Rank | In Labor Force | Age 35-44 |
| Kiowa | 0.0 /100 | #333 | Tragic 79.2% |
| Yakama | 0.0 /100 | #334 | Tragic 79.0% |
| Natives/Alaskans | 0.0 /100 | #335 | Tragic 78.9% |
| Arapaho | 0.0 /100 | #336 | Tragic 78.1% |
| Apache | 0.0 /100 | #337 | Tragic 77.9% |
| Pueblo | 0.0 /100 | #338 | Tragic 77.4% |
| Yup'ik | 0.0 /100 | #339 | Tragic 77.3% |
| Lumbee | 0.0 /100 | #340 | Tragic 77.0% |
| Hopi | 0.0 /100 | #341 | Tragic 77.0% |
| Crow | 0.0 /100 | #342 | Tragic 76.5% |
| Immigrants | Yemen | 0.0 /100 | #343 | Tragic 76.3% |
| Pima | 0.0 /100 | #344 | Tragic 74.8% |
| Yuman | 0.0 /100 | #345 | Tragic 74.7% |
| Tohono O'odham | 0.0 /100 | #346 | Tragic 74.1% |
| Navajo | 0.0 /100 | #347 | Tragic 73.8% |