Aleut vs Iraqi Vision Disability
COMPARE
Aleut
Iraqi
Vision Disability
Vision Disability Comparison
Aleuts
Iraqis
2.6%
VISION DISABILITY
0.0/ 100
METRIC RATING
304th/ 347
METRIC RANK
2.1%
VISION DISABILITY
67.7/ 100
METRIC RATING
161st/ 347
METRIC RANK
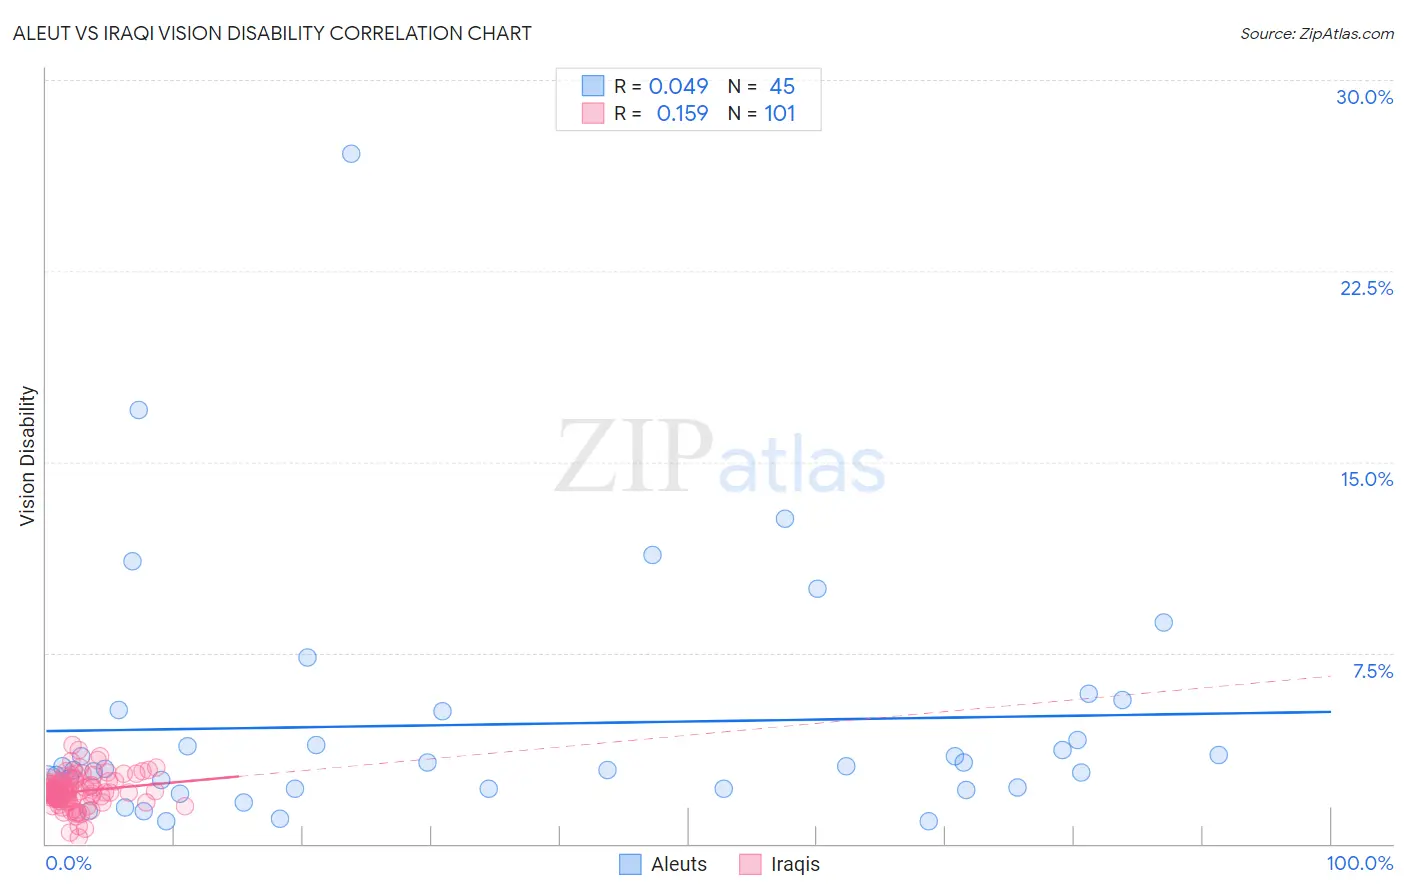
Aleut vs Iraqi Vision Disability Correlation Chart
The statistical analysis conducted on geographies consisting of 61,773,801 people shows no correlation between the proportion of Aleuts and percentage of population with vision disability in the United States with a correlation coefficient (R) of 0.049 and weighted average of 2.6%. Similarly, the statistical analysis conducted on geographies consisting of 170,621,066 people shows a poor positive correlation between the proportion of Iraqis and percentage of population with vision disability in the United States with a correlation coefficient (R) of 0.159 and weighted average of 2.1%, a difference of 20.7%.
Vision Disability Correlation Summary
| Measurement | Aleut | Iraqi |
| Minimum | 0.87% | 0.23% |
| Maximum | 27.1% | 3.9% |
| Range | 26.2% | 3.7% |
| Mean | 4.7% | 2.1% |
| Median | 3.0% | 2.0% |
| Interquartile 25% (IQ1) | 2.2% | 1.8% |
| Interquartile 75% (IQ3) | 5.2% | 2.4% |
| Interquartile Range (IQR) | 3.1% | 0.64% |
| Standard Deviation (Sample) | 4.9% | 0.63% |
| Standard Deviation (Population) | 4.8% | 0.63% |
Similar Demographics by Vision Disability
Demographics Similar to Aleuts by Vision Disability
In terms of vision disability, the demographic groups most similar to Aleuts are Immigrants from Cabo Verde (2.6%, a difference of 0.13%), Hispanic or Latino (2.6%, a difference of 0.30%), Spanish American Indian (2.6%, a difference of 0.36%), Iroquois (2.6%, a difference of 0.91%), and Immigrants from Dominican Republic (2.6%, a difference of 0.94%).
| Demographics | Rating | Rank | Vision Disability |
| Immigrants | Dominica | 0.0 /100 | #297 | Tragic 2.5% |
| Mexicans | 0.0 /100 | #298 | Tragic 2.5% |
| Cree | 0.0 /100 | #299 | Tragic 2.5% |
| Africans | 0.0 /100 | #300 | Tragic 2.5% |
| Menominee | 0.0 /100 | #301 | Tragic 2.5% |
| Spanish American Indians | 0.0 /100 | #302 | Tragic 2.6% |
| Immigrants | Cabo Verde | 0.0 /100 | #303 | Tragic 2.6% |
| Aleuts | 0.0 /100 | #304 | Tragic 2.6% |
| Hispanics or Latinos | 0.0 /100 | #305 | Tragic 2.6% |
| Iroquois | 0.0 /100 | #306 | Tragic 2.6% |
| Immigrants | Dominican Republic | 0.0 /100 | #307 | Tragic 2.6% |
| Arapaho | 0.0 /100 | #308 | Tragic 2.6% |
| Immigrants | Yemen | 0.0 /100 | #309 | Tragic 2.6% |
| Blackfeet | 0.0 /100 | #310 | Tragic 2.6% |
| Dominicans | 0.0 /100 | #311 | Tragic 2.6% |
Demographics Similar to Iraqis by Vision Disability
In terms of vision disability, the demographic groups most similar to Iraqis are Hungarian (2.1%, a difference of 0.030%), Austrian (2.1%, a difference of 0.090%), Icelander (2.1%, a difference of 0.12%), South African (2.1%, a difference of 0.15%), and Immigrants from Uzbekistan (2.1%, a difference of 0.16%).
| Demographics | Rating | Rank | Vision Disability |
| Slovenes | 73.6 /100 | #154 | Good 2.1% |
| Immigrants | Colombia | 72.1 /100 | #155 | Good 2.1% |
| Pakistanis | 71.6 /100 | #156 | Good 2.1% |
| Serbians | 70.2 /100 | #157 | Good 2.1% |
| Immigrants | Uzbekistan | 69.9 /100 | #158 | Good 2.1% |
| South Africans | 69.8 /100 | #159 | Good 2.1% |
| Austrians | 69.0 /100 | #160 | Good 2.1% |
| Iraqis | 67.7 /100 | #161 | Good 2.1% |
| Hungarians | 67.4 /100 | #162 | Good 2.1% |
| Icelanders | 66.1 /100 | #163 | Good 2.1% |
| Immigrants | Bangladesh | 65.5 /100 | #164 | Good 2.1% |
| Immigrants | Iraq | 64.8 /100 | #165 | Good 2.1% |
| Immigrants | England | 62.8 /100 | #166 | Good 2.1% |
| Immigrants | Africa | 62.6 /100 | #167 | Good 2.1% |
| Brazilians | 62.2 /100 | #168 | Good 2.1% |