Zimbabwean vs Immigrants from El Salvador Householder Income Ages 45 - 64 years
COMPARE
Zimbabwean
Immigrants from El Salvador
Householder Income Ages 45 - 64 years
Householder Income Ages 45 - 64 years Comparison
Zimbabweans
Immigrants from El Salvador
$106,849
HOUSEHOLDER INCOME AGES 45 - 64 YEARS
96.3/ 100
METRIC RATING
108th/ 347
METRIC RANK
$93,176
HOUSEHOLDER INCOME AGES 45 - 64 YEARS
2.7/ 100
METRIC RATING
234th/ 347
METRIC RANK
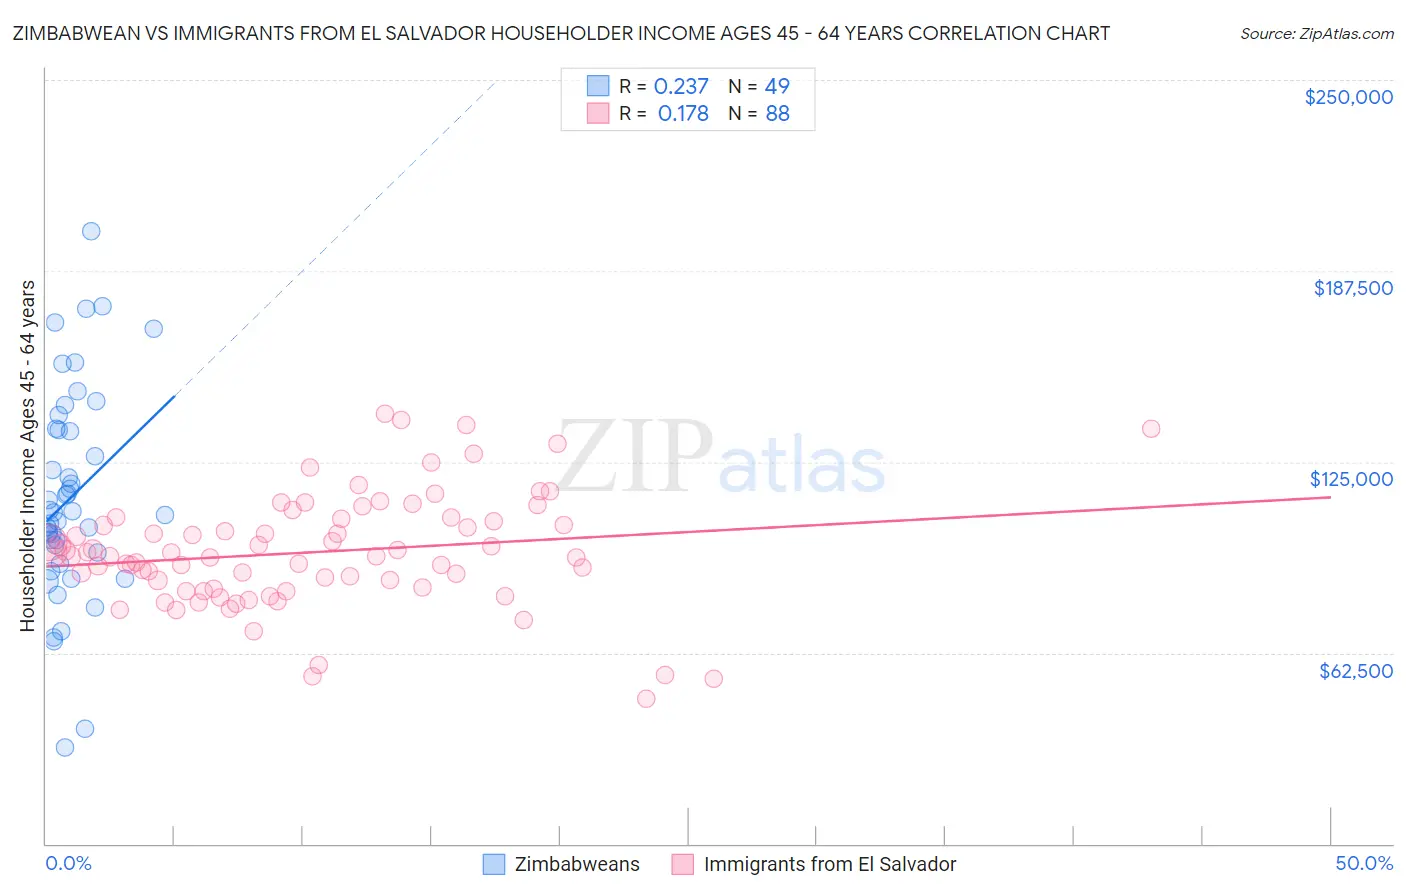
Zimbabwean vs Immigrants from El Salvador Householder Income Ages 45 - 64 years Correlation Chart
The statistical analysis conducted on geographies consisting of 69,179,320 people shows a weak positive correlation between the proportion of Zimbabweans and household income with householder between the ages 45 and 64 in the United States with a correlation coefficient (R) of 0.237 and weighted average of $106,849. Similarly, the statistical analysis conducted on geographies consisting of 357,351,830 people shows a poor positive correlation between the proportion of Immigrants from El Salvador and household income with householder between the ages 45 and 64 in the United States with a correlation coefficient (R) of 0.178 and weighted average of $93,176, a difference of 14.7%.
Householder Income Ages 45 - 64 years Correlation Summary
| Measurement | Zimbabwean | Immigrants from El Salvador |
| Minimum | $31,641 | $47,339 |
| Maximum | $200,450 | $140,748 |
| Range | $168,809 | $93,409 |
| Mean | $113,309 | $95,436 |
| Median | $108,283 | $94,032 |
| Interquartile 25% (IQ1) | $93,481 | $83,646 |
| Interquartile 75% (IQ3) | $135,585 | $106,007 |
| Interquartile Range (IQR) | $42,104 | $22,361 |
| Standard Deviation (Sample) | $34,490 | $18,513 |
| Standard Deviation (Population) | $34,136 | $18,408 |
Similar Demographics by Householder Income Ages 45 - 64 years
Demographics Similar to Zimbabweans by Householder Income Ages 45 - 64 years
In terms of householder income ages 45 - 64 years, the demographic groups most similar to Zimbabweans are Immigrants from Fiji ($106,952, a difference of 0.10%), Armenian ($107,002, a difference of 0.14%), Macedonian ($107,074, a difference of 0.21%), Immigrants from Ukraine ($107,079, a difference of 0.22%), and Chilean ($106,611, a difference of 0.22%).
| Demographics | Rating | Rank | Householder Income Ages 45 - 64 years |
| Immigrants | Kazakhstan | 97.2 /100 | #101 | Exceptional $107,378 |
| Immigrants | Moldova | 97.1 /100 | #102 | Exceptional $107,357 |
| Syrians | 96.9 /100 | #103 | Exceptional $107,207 |
| Immigrants | Ukraine | 96.7 /100 | #104 | Exceptional $107,079 |
| Macedonians | 96.7 /100 | #105 | Exceptional $107,074 |
| Armenians | 96.6 /100 | #106 | Exceptional $107,002 |
| Immigrants | Fiji | 96.5 /100 | #107 | Exceptional $106,952 |
| Zimbabweans | 96.3 /100 | #108 | Exceptional $106,849 |
| Chileans | 95.9 /100 | #109 | Exceptional $106,611 |
| Immigrants | Brazil | 95.6 /100 | #110 | Exceptional $106,470 |
| Immigrants | Vietnam | 95.5 /100 | #111 | Exceptional $106,417 |
| Swedes | 95.4 /100 | #112 | Exceptional $106,377 |
| Europeans | 95.4 /100 | #113 | Exceptional $106,367 |
| Immigrants | Poland | 95.3 /100 | #114 | Exceptional $106,319 |
| Immigrants | Kuwait | 95.2 /100 | #115 | Exceptional $106,285 |
Demographics Similar to Immigrants from El Salvador by Householder Income Ages 45 - 64 years
In terms of householder income ages 45 - 64 years, the demographic groups most similar to Immigrants from El Salvador are Nepalese ($93,355, a difference of 0.19%), Sudanese ($93,718, a difference of 0.58%), Ecuadorian ($93,739, a difference of 0.60%), Immigrants from Sudan ($93,781, a difference of 0.65%), and Vietnamese ($93,788, a difference of 0.66%).
| Demographics | Rating | Rank | Householder Income Ages 45 - 64 years |
| Alaska Natives | 4.0 /100 | #227 | Tragic $93,991 |
| Immigrants | Panama | 3.7 /100 | #228 | Tragic $93,815 |
| Vietnamese | 3.6 /100 | #229 | Tragic $93,788 |
| Immigrants | Sudan | 3.6 /100 | #230 | Tragic $93,781 |
| Ecuadorians | 3.6 /100 | #231 | Tragic $93,739 |
| Sudanese | 3.5 /100 | #232 | Tragic $93,718 |
| Nepalese | 3.0 /100 | #233 | Tragic $93,355 |
| Immigrants | El Salvador | 2.7 /100 | #234 | Tragic $93,176 |
| Nicaraguans | 2.0 /100 | #235 | Tragic $92,554 |
| Immigrants | Western Africa | 1.8 /100 | #236 | Tragic $92,384 |
| Immigrants | Bangladesh | 1.7 /100 | #237 | Tragic $92,208 |
| Pennsylvania Germans | 1.5 /100 | #238 | Tragic $91,956 |
| Immigrants | Ecuador | 1.2 /100 | #239 | Tragic $91,462 |
| Immigrants | Burma/Myanmar | 1.1 /100 | #240 | Tragic $91,385 |
| Trinidadians and Tobagonians | 1.1 /100 | #241 | Tragic $91,357 |