Yup'ik vs Syrian Householder Income Ages 25 - 44 years
COMPARE
Yup'ik
Syrian
Householder Income Ages 25 - 44 years
Householder Income Ages 25 - 44 years Comparison
Yup'ik
Syrians
$73,688
HOUSEHOLDER INCOME AGES 25 - 44 YEARS
0.0/ 100
METRIC RATING
336th/ 347
METRIC RANK
$99,215
HOUSEHOLDER INCOME AGES 25 - 44 YEARS
92.9/ 100
METRIC RATING
118th/ 347
METRIC RANK
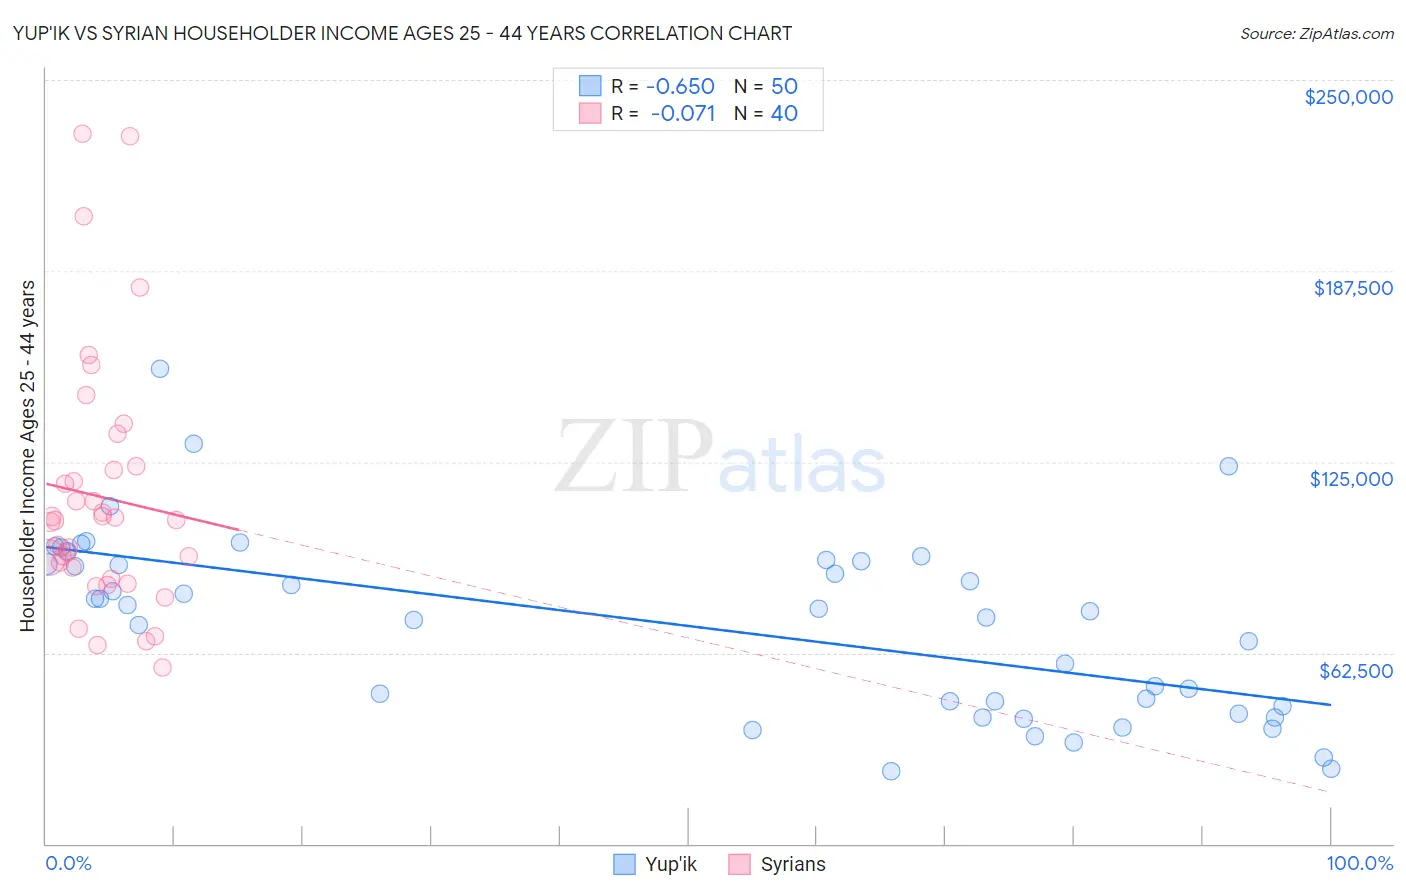
Yup'ik vs Syrian Householder Income Ages 25 - 44 years Correlation Chart
The statistical analysis conducted on geographies consisting of 39,924,420 people shows a significant negative correlation between the proportion of Yup'ik and household income with householder between the ages 25 and 44 in the United States with a correlation coefficient (R) of -0.650 and weighted average of $73,688. Similarly, the statistical analysis conducted on geographies consisting of 265,710,872 people shows a slight negative correlation between the proportion of Syrians and household income with householder between the ages 25 and 44 in the United States with a correlation coefficient (R) of -0.071 and weighted average of $99,215, a difference of 34.6%.
Householder Income Ages 25 - 44 years Correlation Summary
| Measurement | Yup'ik | Syrian |
| Minimum | $23,750 | $57,774 |
| Maximum | $155,658 | $232,386 |
| Range | $131,908 | $174,612 |
| Mean | $71,598 | $113,575 |
| Median | $76,666 | $105,902 |
| Interquartile 25% (IQ1) | $44,951 | $88,495 |
| Interquartile 75% (IQ3) | $92,344 | $122,954 |
| Interquartile Range (IQR) | $47,393 | $34,460 |
| Standard Deviation (Sample) | $29,611 | $41,385 |
| Standard Deviation (Population) | $29,313 | $40,865 |
Similar Demographics by Householder Income Ages 25 - 44 years
Demographics Similar to Yup'ik by Householder Income Ages 25 - 44 years
In terms of householder income ages 25 - 44 years, the demographic groups most similar to Yup'ik are Black/African American ($73,370, a difference of 0.43%), Immigrants from Yemen ($73,043, a difference of 0.88%), Yuman ($72,956, a difference of 1.0%), Kiowa ($74,776, a difference of 1.5%), and Creek ($74,847, a difference of 1.6%).
| Demographics | Rating | Rank | Householder Income Ages 25 - 44 years |
| Seminole | 0.0 /100 | #329 | Tragic $76,584 |
| Yakama | 0.0 /100 | #330 | Tragic $76,226 |
| Natives/Alaskans | 0.0 /100 | #331 | Tragic $75,647 |
| Bahamians | 0.0 /100 | #332 | Tragic $75,395 |
| Hopi | 0.0 /100 | #333 | Tragic $75,002 |
| Creek | 0.0 /100 | #334 | Tragic $74,847 |
| Kiowa | 0.0 /100 | #335 | Tragic $74,776 |
| Yup'ik | 0.0 /100 | #336 | Tragic $73,688 |
| Blacks/African Americans | 0.0 /100 | #337 | Tragic $73,370 |
| Immigrants | Yemen | 0.0 /100 | #338 | Tragic $73,043 |
| Yuman | 0.0 /100 | #339 | Tragic $72,956 |
| Immigrants | Congo | 0.0 /100 | #340 | Tragic $72,178 |
| Arapaho | 0.0 /100 | #341 | Tragic $71,697 |
| Crow | 0.0 /100 | #342 | Tragic $71,337 |
| Tohono O'odham | 0.0 /100 | #343 | Tragic $69,068 |
Demographics Similar to Syrians by Householder Income Ages 25 - 44 years
In terms of householder income ages 25 - 44 years, the demographic groups most similar to Syrians are Immigrants from Northern Africa ($99,232, a difference of 0.020%), Jordanian ($99,186, a difference of 0.030%), Swedish ($99,136, a difference of 0.080%), Portuguese ($99,429, a difference of 0.22%), and Carpatho Rusyn ($99,449, a difference of 0.24%).
| Demographics | Rating | Rank | Householder Income Ages 25 - 44 years |
| Chileans | 95.1 /100 | #111 | Exceptional $99,900 |
| Poles | 94.5 /100 | #112 | Exceptional $99,685 |
| Tongans | 94.2 /100 | #113 | Exceptional $99,604 |
| Immigrants | Western Asia | 94.0 /100 | #114 | Exceptional $99,516 |
| Carpatho Rusyns | 93.7 /100 | #115 | Exceptional $99,449 |
| Portuguese | 93.7 /100 | #116 | Exceptional $99,429 |
| Immigrants | Northern Africa | 93.0 /100 | #117 | Exceptional $99,232 |
| Syrians | 92.9 /100 | #118 | Exceptional $99,215 |
| Jordanians | 92.8 /100 | #119 | Exceptional $99,186 |
| Swedes | 92.7 /100 | #120 | Exceptional $99,136 |
| Peruvians | 91.7 /100 | #121 | Exceptional $98,886 |
| Immigrants | Uzbekistan | 91.5 /100 | #122 | Exceptional $98,849 |
| Palestinians | 91.2 /100 | #123 | Exceptional $98,777 |
| Zimbabweans | 90.3 /100 | #124 | Exceptional $98,586 |
| Pakistanis | 89.3 /100 | #125 | Excellent $98,401 |