Yup'ik vs Armenian Householder Income Ages 25 - 44 years
COMPARE
Yup'ik
Armenian
Householder Income Ages 25 - 44 years
Householder Income Ages 25 - 44 years Comparison
Yup'ik
Armenians
$73,688
HOUSEHOLDER INCOME AGES 25 - 44 YEARS
0.0/ 100
METRIC RATING
336th/ 347
METRIC RANK
$103,248
HOUSEHOLDER INCOME AGES 25 - 44 YEARS
99.2/ 100
METRIC RATING
79th/ 347
METRIC RANK
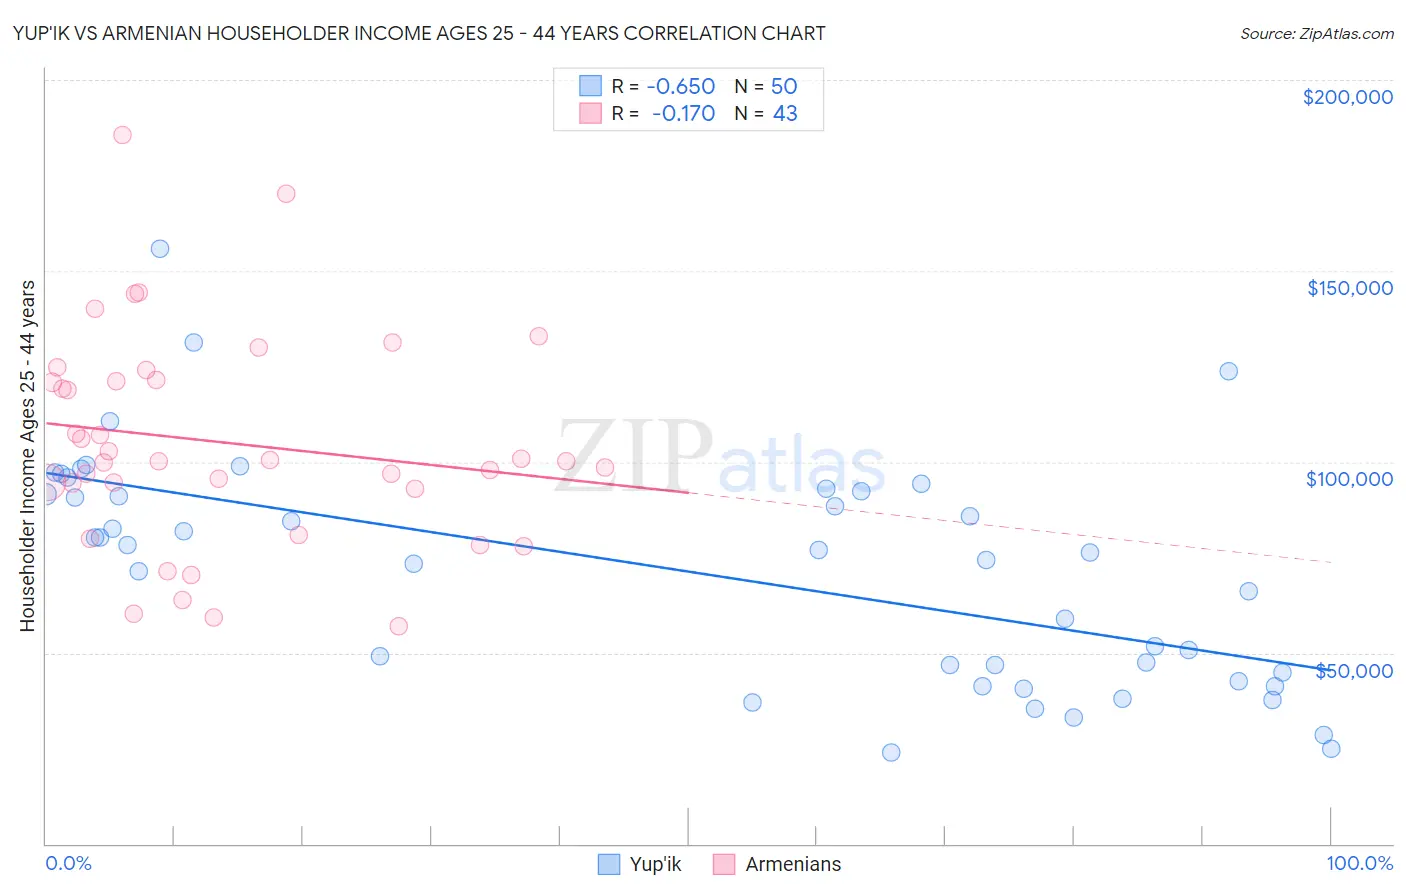
Yup'ik vs Armenian Householder Income Ages 25 - 44 years Correlation Chart
The statistical analysis conducted on geographies consisting of 39,924,420 people shows a significant negative correlation between the proportion of Yup'ik and household income with householder between the ages 25 and 44 in the United States with a correlation coefficient (R) of -0.650 and weighted average of $73,688. Similarly, the statistical analysis conducted on geographies consisting of 310,247,429 people shows a poor negative correlation between the proportion of Armenians and household income with householder between the ages 25 and 44 in the United States with a correlation coefficient (R) of -0.170 and weighted average of $103,248, a difference of 40.1%.
Householder Income Ages 25 - 44 years Correlation Summary
| Measurement | Yup'ik | Armenian |
| Minimum | $23,750 | $56,917 |
| Maximum | $155,658 | $185,535 |
| Range | $131,908 | $128,618 |
| Mean | $71,598 | $105,016 |
| Median | $76,666 | $100,154 |
| Interquartile 25% (IQ1) | $44,951 | $92,917 |
| Interquartile 75% (IQ3) | $92,344 | $121,535 |
| Interquartile Range (IQR) | $47,393 | $28,618 |
| Standard Deviation (Sample) | $29,611 | $28,063 |
| Standard Deviation (Population) | $29,313 | $27,735 |
Similar Demographics by Householder Income Ages 25 - 44 years
Demographics Similar to Yup'ik by Householder Income Ages 25 - 44 years
In terms of householder income ages 25 - 44 years, the demographic groups most similar to Yup'ik are Black/African American ($73,370, a difference of 0.43%), Immigrants from Yemen ($73,043, a difference of 0.88%), Yuman ($72,956, a difference of 1.0%), Kiowa ($74,776, a difference of 1.5%), and Creek ($74,847, a difference of 1.6%).
| Demographics | Rating | Rank | Householder Income Ages 25 - 44 years |
| Seminole | 0.0 /100 | #329 | Tragic $76,584 |
| Yakama | 0.0 /100 | #330 | Tragic $76,226 |
| Natives/Alaskans | 0.0 /100 | #331 | Tragic $75,647 |
| Bahamians | 0.0 /100 | #332 | Tragic $75,395 |
| Hopi | 0.0 /100 | #333 | Tragic $75,002 |
| Creek | 0.0 /100 | #334 | Tragic $74,847 |
| Kiowa | 0.0 /100 | #335 | Tragic $74,776 |
| Yup'ik | 0.0 /100 | #336 | Tragic $73,688 |
| Blacks/African Americans | 0.0 /100 | #337 | Tragic $73,370 |
| Immigrants | Yemen | 0.0 /100 | #338 | Tragic $73,043 |
| Yuman | 0.0 /100 | #339 | Tragic $72,956 |
| Immigrants | Congo | 0.0 /100 | #340 | Tragic $72,178 |
| Arapaho | 0.0 /100 | #341 | Tragic $71,697 |
| Crow | 0.0 /100 | #342 | Tragic $71,337 |
| Tohono O'odham | 0.0 /100 | #343 | Tragic $69,068 |
Demographics Similar to Armenians by Householder Income Ages 25 - 44 years
In terms of householder income ages 25 - 44 years, the demographic groups most similar to Armenians are Immigrants from Egypt ($103,192, a difference of 0.050%), South African ($103,160, a difference of 0.080%), Immigrants from Serbia ($103,155, a difference of 0.090%), Argentinean ($103,111, a difference of 0.13%), and Immigrants from Bulgaria ($103,423, a difference of 0.17%).
| Demographics | Rating | Rank | Householder Income Ages 25 - 44 years |
| Chinese | 99.5 /100 | #72 | Exceptional $104,264 |
| Italians | 99.5 /100 | #73 | Exceptional $104,215 |
| Immigrants | Fiji | 99.5 /100 | #74 | Exceptional $103,954 |
| Koreans | 99.4 /100 | #75 | Exceptional $103,824 |
| Immigrants | Spain | 99.4 /100 | #76 | Exceptional $103,752 |
| Immigrants | Southern Europe | 99.3 /100 | #77 | Exceptional $103,486 |
| Immigrants | Bulgaria | 99.3 /100 | #78 | Exceptional $103,423 |
| Armenians | 99.2 /100 | #79 | Exceptional $103,248 |
| Immigrants | Egypt | 99.2 /100 | #80 | Exceptional $103,192 |
| South Africans | 99.2 /100 | #81 | Exceptional $103,160 |
| Immigrants | Serbia | 99.2 /100 | #82 | Exceptional $103,155 |
| Argentineans | 99.1 /100 | #83 | Exceptional $103,111 |
| Immigrants | Philippines | 99.0 /100 | #84 | Exceptional $102,910 |
| Immigrants | Ukraine | 98.9 /100 | #85 | Exceptional $102,664 |
| Immigrants | Hungary | 98.9 /100 | #86 | Exceptional $102,655 |