Eastern European vs Syrian Householder Income Ages 25 - 44 years
COMPARE
Eastern European
Syrian
Householder Income Ages 25 - 44 years
Householder Income Ages 25 - 44 years Comparison
Eastern Europeans
Syrians
$114,523
HOUSEHOLDER INCOME AGES 25 - 44 YEARS
100.0/ 100
METRIC RATING
18th/ 347
METRIC RANK
$99,215
HOUSEHOLDER INCOME AGES 25 - 44 YEARS
92.9/ 100
METRIC RATING
118th/ 347
METRIC RANK
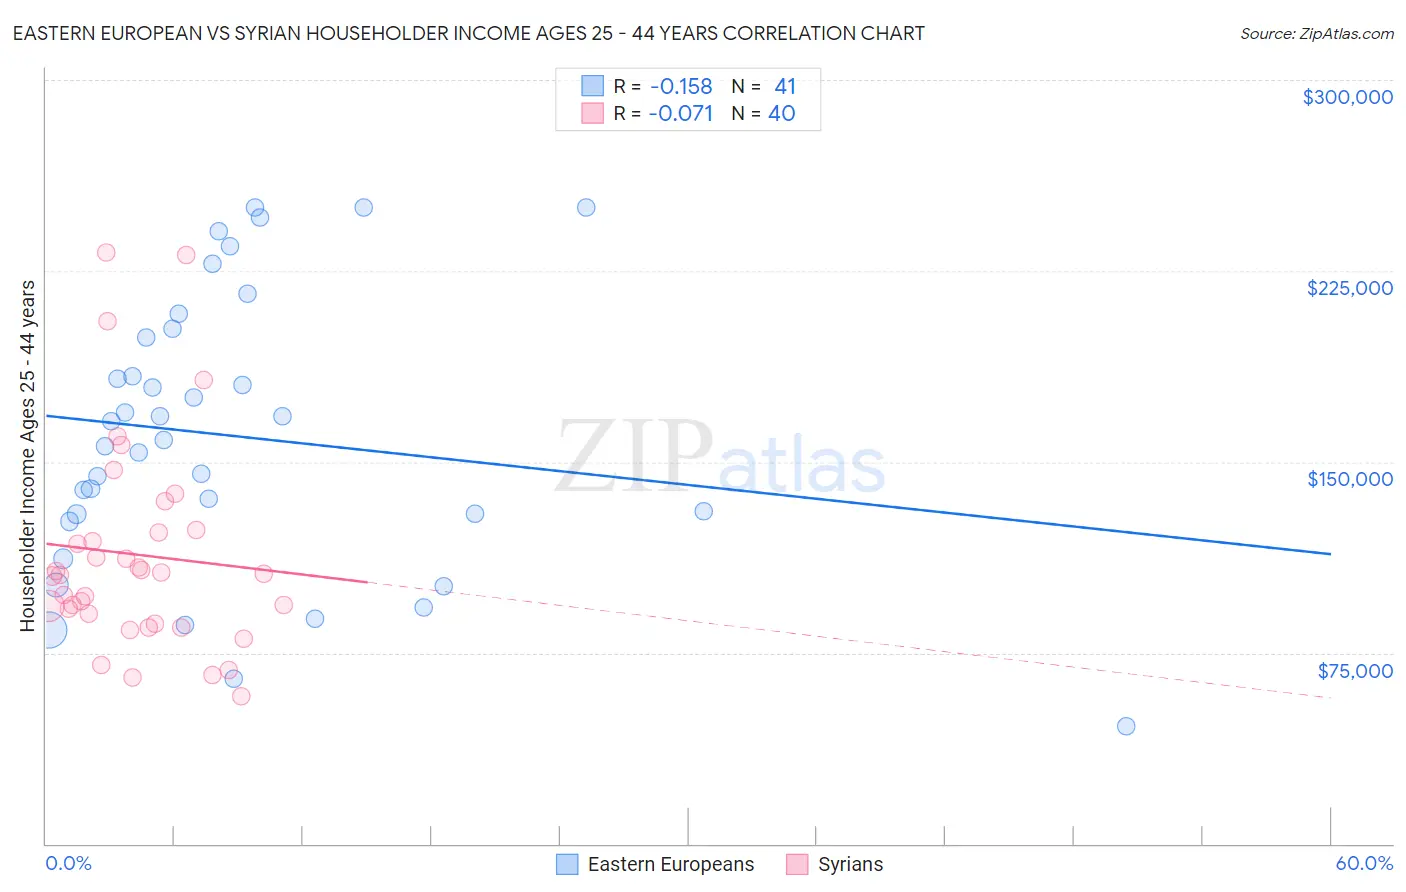
Eastern European vs Syrian Householder Income Ages 25 - 44 years Correlation Chart
The statistical analysis conducted on geographies consisting of 459,307,576 people shows a poor negative correlation between the proportion of Eastern Europeans and household income with householder between the ages 25 and 44 in the United States with a correlation coefficient (R) of -0.158 and weighted average of $114,523. Similarly, the statistical analysis conducted on geographies consisting of 265,710,872 people shows a slight negative correlation between the proportion of Syrians and household income with householder between the ages 25 and 44 in the United States with a correlation coefficient (R) of -0.071 and weighted average of $99,215, a difference of 15.4%.
Householder Income Ages 25 - 44 years Correlation Summary
| Measurement | Eastern European | Syrian |
| Minimum | $46,280 | $57,774 |
| Maximum | $250,001 | $232,386 |
| Range | $203,721 | $174,612 |
| Mean | $160,039 | $113,575 |
| Median | $158,530 | $105,902 |
| Interquartile 25% (IQ1) | $128,065 | $88,495 |
| Interquartile 75% (IQ3) | $200,429 | $122,954 |
| Interquartile Range (IQR) | $72,364 | $34,460 |
| Standard Deviation (Sample) | $54,167 | $41,385 |
| Standard Deviation (Population) | $53,502 | $40,865 |
Similar Demographics by Householder Income Ages 25 - 44 years
Demographics Similar to Eastern Europeans by Householder Income Ages 25 - 44 years
In terms of householder income ages 25 - 44 years, the demographic groups most similar to Eastern Europeans are Burmese ($113,701, a difference of 0.72%), Immigrants from Korea ($113,401, a difference of 0.99%), Immigrants from Australia ($115,947, a difference of 1.2%), Cypriot ($116,364, a difference of 1.6%), and Asian ($112,666, a difference of 1.7%).
| Demographics | Rating | Rank | Householder Income Ages 25 - 44 years |
| Okinawans | 100.0 /100 | #11 | Exceptional $119,349 |
| Immigrants | Iran | 100.0 /100 | #12 | Exceptional $119,204 |
| Immigrants | Eastern Asia | 100.0 /100 | #13 | Exceptional $118,056 |
| Immigrants | Israel | 100.0 /100 | #14 | Exceptional $117,219 |
| Immigrants | South Central Asia | 100.0 /100 | #15 | Exceptional $116,626 |
| Cypriots | 100.0 /100 | #16 | Exceptional $116,364 |
| Immigrants | Australia | 100.0 /100 | #17 | Exceptional $115,947 |
| Eastern Europeans | 100.0 /100 | #18 | Exceptional $114,523 |
| Burmese | 100.0 /100 | #19 | Exceptional $113,701 |
| Immigrants | Korea | 100.0 /100 | #20 | Exceptional $113,401 |
| Asians | 100.0 /100 | #21 | Exceptional $112,666 |
| Immigrants | Belgium | 100.0 /100 | #22 | Exceptional $112,575 |
| Immigrants | Japan | 100.0 /100 | #23 | Exceptional $112,228 |
| Immigrants | Sweden | 100.0 /100 | #24 | Exceptional $112,010 |
| Immigrants | Northern Europe | 100.0 /100 | #25 | Exceptional $111,676 |
Demographics Similar to Syrians by Householder Income Ages 25 - 44 years
In terms of householder income ages 25 - 44 years, the demographic groups most similar to Syrians are Immigrants from Northern Africa ($99,232, a difference of 0.020%), Jordanian ($99,186, a difference of 0.030%), Swedish ($99,136, a difference of 0.080%), Portuguese ($99,429, a difference of 0.22%), and Carpatho Rusyn ($99,449, a difference of 0.24%).
| Demographics | Rating | Rank | Householder Income Ages 25 - 44 years |
| Chileans | 95.1 /100 | #111 | Exceptional $99,900 |
| Poles | 94.5 /100 | #112 | Exceptional $99,685 |
| Tongans | 94.2 /100 | #113 | Exceptional $99,604 |
| Immigrants | Western Asia | 94.0 /100 | #114 | Exceptional $99,516 |
| Carpatho Rusyns | 93.7 /100 | #115 | Exceptional $99,449 |
| Portuguese | 93.7 /100 | #116 | Exceptional $99,429 |
| Immigrants | Northern Africa | 93.0 /100 | #117 | Exceptional $99,232 |
| Syrians | 92.9 /100 | #118 | Exceptional $99,215 |
| Jordanians | 92.8 /100 | #119 | Exceptional $99,186 |
| Swedes | 92.7 /100 | #120 | Exceptional $99,136 |
| Peruvians | 91.7 /100 | #121 | Exceptional $98,886 |
| Immigrants | Uzbekistan | 91.5 /100 | #122 | Exceptional $98,849 |
| Palestinians | 91.2 /100 | #123 | Exceptional $98,777 |
| Zimbabweans | 90.3 /100 | #124 | Exceptional $98,586 |
| Pakistanis | 89.3 /100 | #125 | Excellent $98,401 |