Immigrants from China vs Dominican Householder Income Ages 25 - 44 years
COMPARE
Immigrants from China
Dominican
Householder Income Ages 25 - 44 years
Householder Income Ages 25 - 44 years Comparison
Immigrants from China
Dominicans
$119,756
HOUSEHOLDER INCOME AGES 25 - 44 YEARS
100.0/ 100
METRIC RATING
9th/ 347
METRIC RANK
$81,229
HOUSEHOLDER INCOME AGES 25 - 44 YEARS
0.1/ 100
METRIC RATING
298th/ 347
METRIC RANK
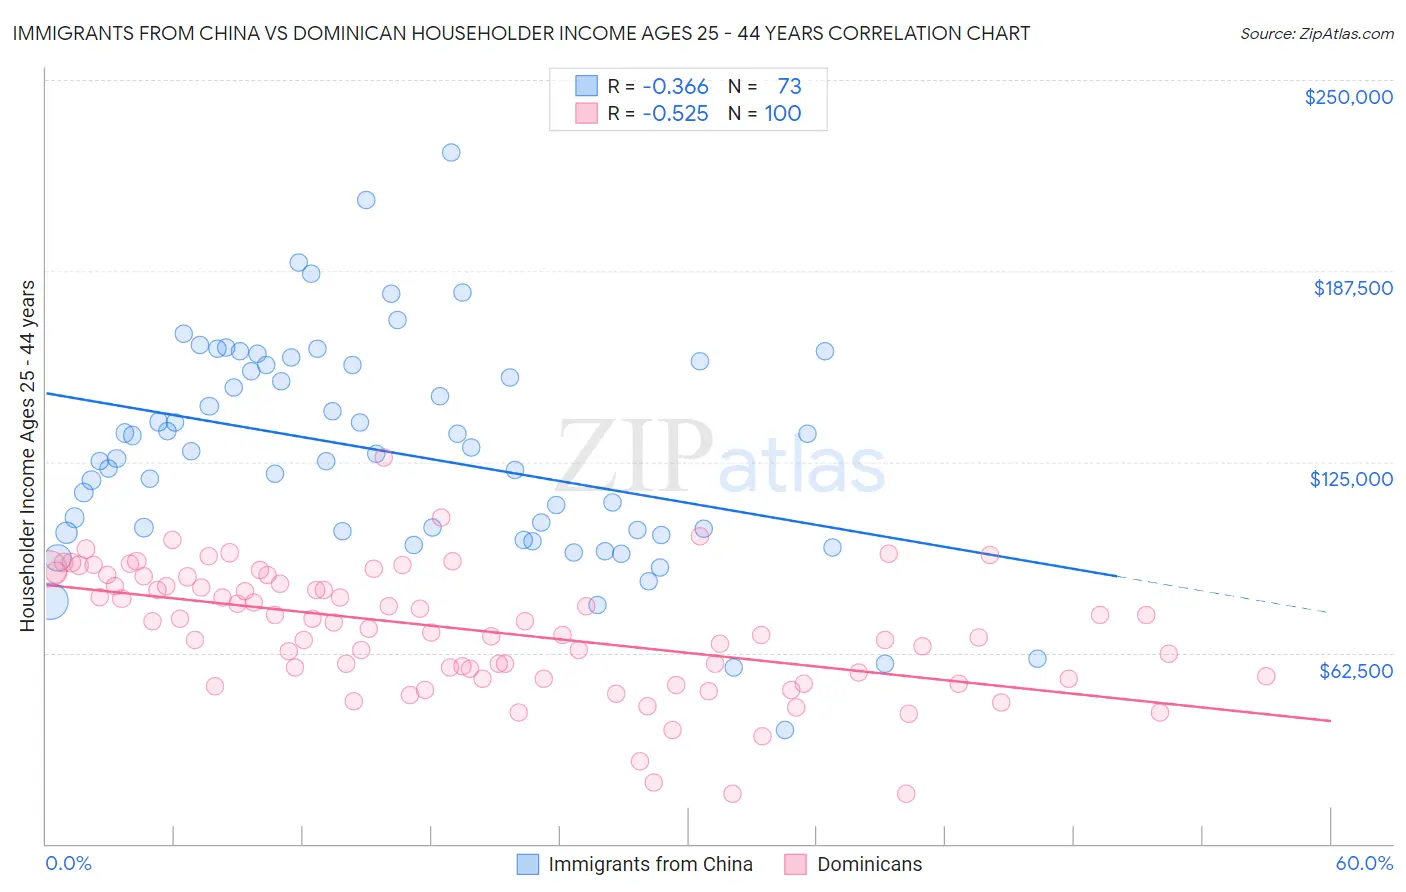
Immigrants from China vs Dominican Householder Income Ages 25 - 44 years Correlation Chart
The statistical analysis conducted on geographies consisting of 455,414,350 people shows a mild negative correlation between the proportion of Immigrants from China and household income with householder between the ages 25 and 44 in the United States with a correlation coefficient (R) of -0.366 and weighted average of $119,756. Similarly, the statistical analysis conducted on geographies consisting of 354,179,594 people shows a substantial negative correlation between the proportion of Dominicans and household income with householder between the ages 25 and 44 in the United States with a correlation coefficient (R) of -0.525 and weighted average of $81,229, a difference of 47.4%.
Householder Income Ages 25 - 44 years Correlation Summary
| Measurement | Immigrants from China | Dominican |
| Minimum | $37,292 | $16,282 |
| Maximum | $226,084 | $126,257 |
| Range | $188,792 | $109,975 |
| Mean | $128,177 | $69,757 |
| Median | $127,614 | $71,447 |
| Interquartile 25% (IQ1) | $101,947 | $54,470 |
| Interquartile 75% (IQ3) | $156,639 | $86,209 |
| Interquartile Range (IQR) | $54,692 | $31,740 |
| Standard Deviation (Sample) | $35,872 | $20,437 |
| Standard Deviation (Population) | $35,626 | $20,334 |
Similar Demographics by Householder Income Ages 25 - 44 years
Demographics Similar to Immigrants from China by Householder Income Ages 25 - 44 years
In terms of householder income ages 25 - 44 years, the demographic groups most similar to Immigrants from China are Indian (Asian) ($119,496, a difference of 0.22%), Okinawan ($119,349, a difference of 0.34%), Iranian ($120,292, a difference of 0.45%), Immigrants from Iran ($119,204, a difference of 0.46%), and Immigrants from Ireland ($120,333, a difference of 0.48%).
| Demographics | Rating | Rank | Householder Income Ages 25 - 44 years |
| Filipinos | 100.0 /100 | #2 | Exceptional $128,723 |
| Immigrants | Hong Kong | 100.0 /100 | #3 | Exceptional $128,140 |
| Immigrants | Singapore | 100.0 /100 | #4 | Exceptional $124,429 |
| Immigrants | India | 100.0 /100 | #5 | Exceptional $124,238 |
| Thais | 100.0 /100 | #6 | Exceptional $121,778 |
| Immigrants | Ireland | 100.0 /100 | #7 | Exceptional $120,333 |
| Iranians | 100.0 /100 | #8 | Exceptional $120,292 |
| Immigrants | China | 100.0 /100 | #9 | Exceptional $119,756 |
| Indians (Asian) | 100.0 /100 | #10 | Exceptional $119,496 |
| Okinawans | 100.0 /100 | #11 | Exceptional $119,349 |
| Immigrants | Iran | 100.0 /100 | #12 | Exceptional $119,204 |
| Immigrants | Eastern Asia | 100.0 /100 | #13 | Exceptional $118,056 |
| Immigrants | Israel | 100.0 /100 | #14 | Exceptional $117,219 |
| Immigrants | South Central Asia | 100.0 /100 | #15 | Exceptional $116,626 |
| Cypriots | 100.0 /100 | #16 | Exceptional $116,364 |
Demographics Similar to Dominicans by Householder Income Ages 25 - 44 years
In terms of householder income ages 25 - 44 years, the demographic groups most similar to Dominicans are Immigrants from Guatemala ($81,341, a difference of 0.14%), Immigrants from Dominica ($81,351, a difference of 0.15%), Bangladeshi ($81,363, a difference of 0.17%), Cuban ($81,483, a difference of 0.31%), and Blackfeet ($81,531, a difference of 0.37%).
| Demographics | Rating | Rank | Householder Income Ages 25 - 44 years |
| Potawatomi | 0.1 /100 | #291 | Tragic $81,774 |
| Yaqui | 0.1 /100 | #292 | Tragic $81,656 |
| Blackfeet | 0.1 /100 | #293 | Tragic $81,531 |
| Cubans | 0.1 /100 | #294 | Tragic $81,483 |
| Bangladeshis | 0.1 /100 | #295 | Tragic $81,363 |
| Immigrants | Dominica | 0.1 /100 | #296 | Tragic $81,351 |
| Immigrants | Guatemala | 0.1 /100 | #297 | Tragic $81,341 |
| Dominicans | 0.1 /100 | #298 | Tragic $81,229 |
| Immigrants | Liberia | 0.1 /100 | #299 | Tragic $80,863 |
| Cherokee | 0.0 /100 | #300 | Tragic $80,843 |
| Immigrants | Micronesia | 0.0 /100 | #301 | Tragic $80,544 |
| Hispanics or Latinos | 0.0 /100 | #302 | Tragic $80,515 |
| Mexicans | 0.0 /100 | #303 | Tragic $80,427 |
| Immigrants | Caribbean | 0.0 /100 | #304 | Tragic $80,326 |
| Immigrants | Dominican Republic | 0.0 /100 | #305 | Tragic $80,319 |