Yugoslavian vs Immigrants from Indonesia Per Capita Income
COMPARE
Yugoslavian
Immigrants from Indonesia
Per Capita Income
Per Capita Income Comparison
Yugoslavians
Immigrants from Indonesia
$42,792
PER CAPITA INCOME
27.4/ 100
METRIC RATING
191st/ 347
METRIC RANK
$48,195
PER CAPITA INCOME
99.4/ 100
METRIC RATING
82nd/ 347
METRIC RANK
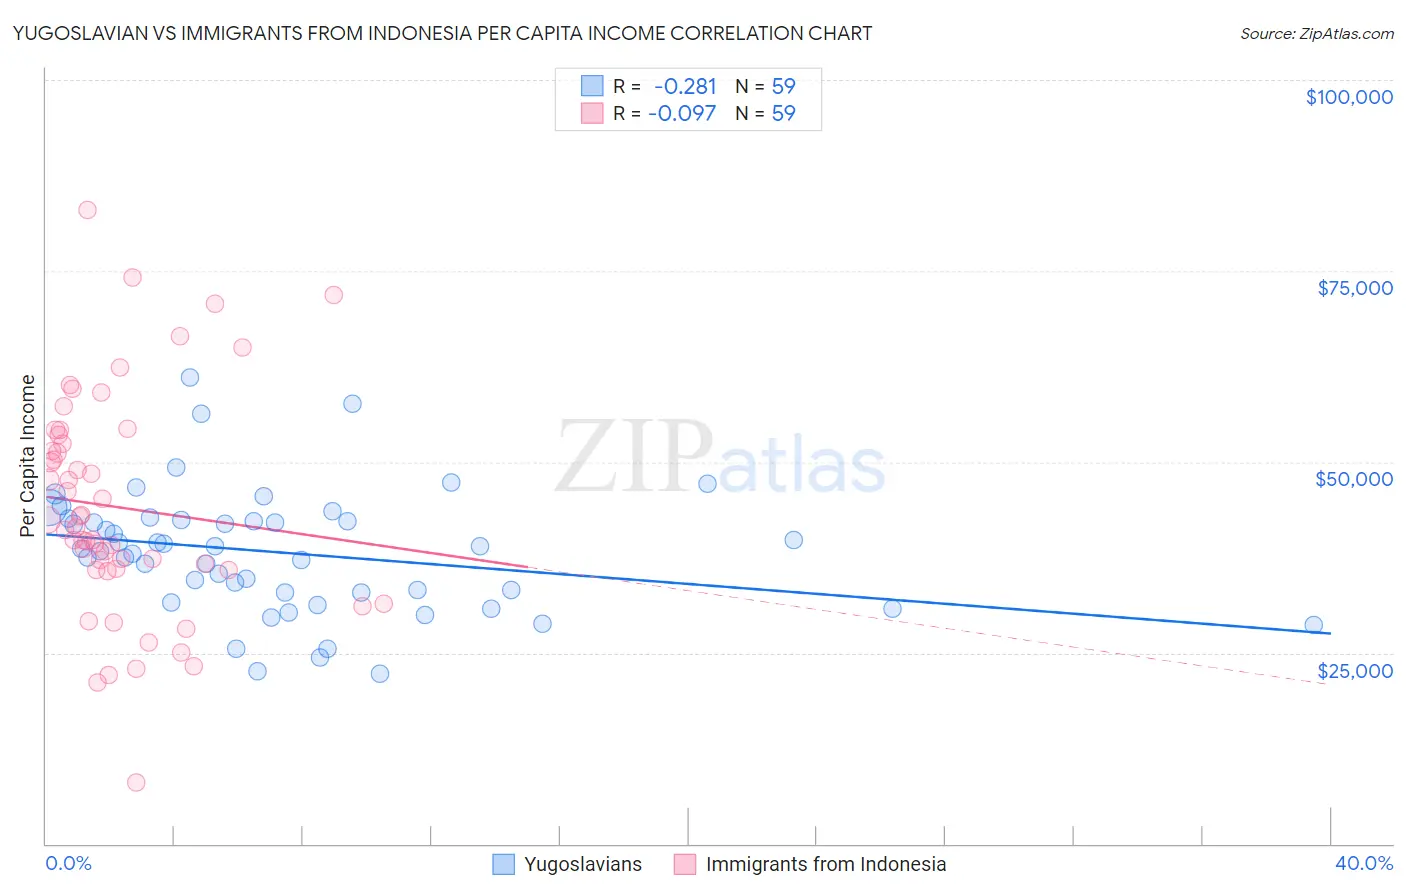
Yugoslavian vs Immigrants from Indonesia Per Capita Income Correlation Chart
The statistical analysis conducted on geographies consisting of 285,729,855 people shows a weak negative correlation between the proportion of Yugoslavians and per capita income in the United States with a correlation coefficient (R) of -0.281 and weighted average of $42,792. Similarly, the statistical analysis conducted on geographies consisting of 215,786,434 people shows a slight negative correlation between the proportion of Immigrants from Indonesia and per capita income in the United States with a correlation coefficient (R) of -0.097 and weighted average of $48,195, a difference of 12.6%.
Per Capita Income Correlation Summary
| Measurement | Yugoslavian | Immigrants from Indonesia |
| Minimum | $22,217 | $8,026 |
| Maximum | $61,060 | $82,949 |
| Range | $38,843 | $74,923 |
| Mean | $38,123 | $44,054 |
| Median | $38,605 | $41,336 |
| Interquartile 25% (IQ1) | $32,828 | $35,904 |
| Interquartile 75% (IQ3) | $42,402 | $53,591 |
| Interquartile Range (IQR) | $9,574 | $17,688 |
| Standard Deviation (Sample) | $8,004 | $14,587 |
| Standard Deviation (Population) | $7,935 | $14,462 |
Similar Demographics by Per Capita Income
Demographics Similar to Yugoslavians by Per Capita Income
In terms of per capita income, the demographic groups most similar to Yugoslavians are Kenyan ($42,808, a difference of 0.040%), Iraqi ($42,760, a difference of 0.070%), Immigrants from Sierra Leone ($42,752, a difference of 0.090%), Immigrants from Fiji ($42,694, a difference of 0.23%), and Bermudan ($42,911, a difference of 0.28%).
| Demographics | Rating | Rank | Per Capita Income |
| Spaniards | 32.9 /100 | #184 | Fair $43,028 |
| Immigrants | Immigrants | 32.5 /100 | #185 | Fair $43,010 |
| French Canadians | 32.3 /100 | #186 | Fair $43,003 |
| Immigrants | Colombia | 31.5 /100 | #187 | Fair $42,971 |
| Immigrants | Africa | 31.0 /100 | #188 | Fair $42,950 |
| Bermudans | 30.1 /100 | #189 | Fair $42,911 |
| Kenyans | 27.7 /100 | #190 | Fair $42,808 |
| Yugoslavians | 27.4 /100 | #191 | Fair $42,792 |
| Iraqis | 26.7 /100 | #192 | Fair $42,760 |
| Immigrants | Sierra Leone | 26.5 /100 | #193 | Fair $42,752 |
| Immigrants | Fiji | 25.2 /100 | #194 | Fair $42,694 |
| Immigrants | Kenya | 24.5 /100 | #195 | Fair $42,661 |
| Dutch | 23.4 /100 | #196 | Fair $42,605 |
| Scotch-Irish | 22.6 /100 | #197 | Fair $42,563 |
| Immigrants | Portugal | 19.7 /100 | #198 | Poor $42,412 |
Demographics Similar to Immigrants from Indonesia by Per Capita Income
In terms of per capita income, the demographic groups most similar to Immigrants from Indonesia are Immigrants from Brazil ($48,164, a difference of 0.060%), Immigrants from Ukraine ($48,134, a difference of 0.13%), Austrian ($48,116, a difference of 0.16%), Armenian ($48,287, a difference of 0.19%), and Egyptian ($48,358, a difference of 0.34%).
| Demographics | Rating | Rank | Per Capita Income |
| Immigrants | Bolivia | 99.7 /100 | #75 | Exceptional $48,970 |
| Immigrants | England | 99.7 /100 | #76 | Exceptional $48,844 |
| Immigrants | Kazakhstan | 99.7 /100 | #77 | Exceptional $48,747 |
| Immigrants | Italy | 99.6 /100 | #78 | Exceptional $48,654 |
| Romanians | 99.5 /100 | #79 | Exceptional $48,445 |
| Egyptians | 99.5 /100 | #80 | Exceptional $48,358 |
| Armenians | 99.4 /100 | #81 | Exceptional $48,287 |
| Immigrants | Indonesia | 99.4 /100 | #82 | Exceptional $48,195 |
| Immigrants | Brazil | 99.4 /100 | #83 | Exceptional $48,164 |
| Immigrants | Ukraine | 99.3 /100 | #84 | Exceptional $48,134 |
| Austrians | 99.3 /100 | #85 | Exceptional $48,116 |
| Immigrants | Southern Europe | 99.3 /100 | #86 | Exceptional $48,027 |
| Ukrainians | 99.3 /100 | #87 | Exceptional $48,014 |
| Croatians | 99.0 /100 | #88 | Exceptional $47,742 |
| Northern Europeans | 98.9 /100 | #89 | Exceptional $47,698 |