Immigrants from Malaysia vs Immigrants from Bosnia and Herzegovina Householder Income Ages 25 - 44 years
COMPARE
Immigrants from Malaysia
Immigrants from Bosnia and Herzegovina
Householder Income Ages 25 - 44 years
Householder Income Ages 25 - 44 years Comparison
Immigrants from Malaysia
Immigrants from Bosnia and Herzegovina
$107,650
HOUSEHOLDER INCOME AGES 25 - 44 YEARS
99.9/ 100
METRIC RATING
43rd/ 347
METRIC RANK
$88,819
HOUSEHOLDER INCOME AGES 25 - 44 YEARS
4.0/ 100
METRIC RATING
228th/ 347
METRIC RANK
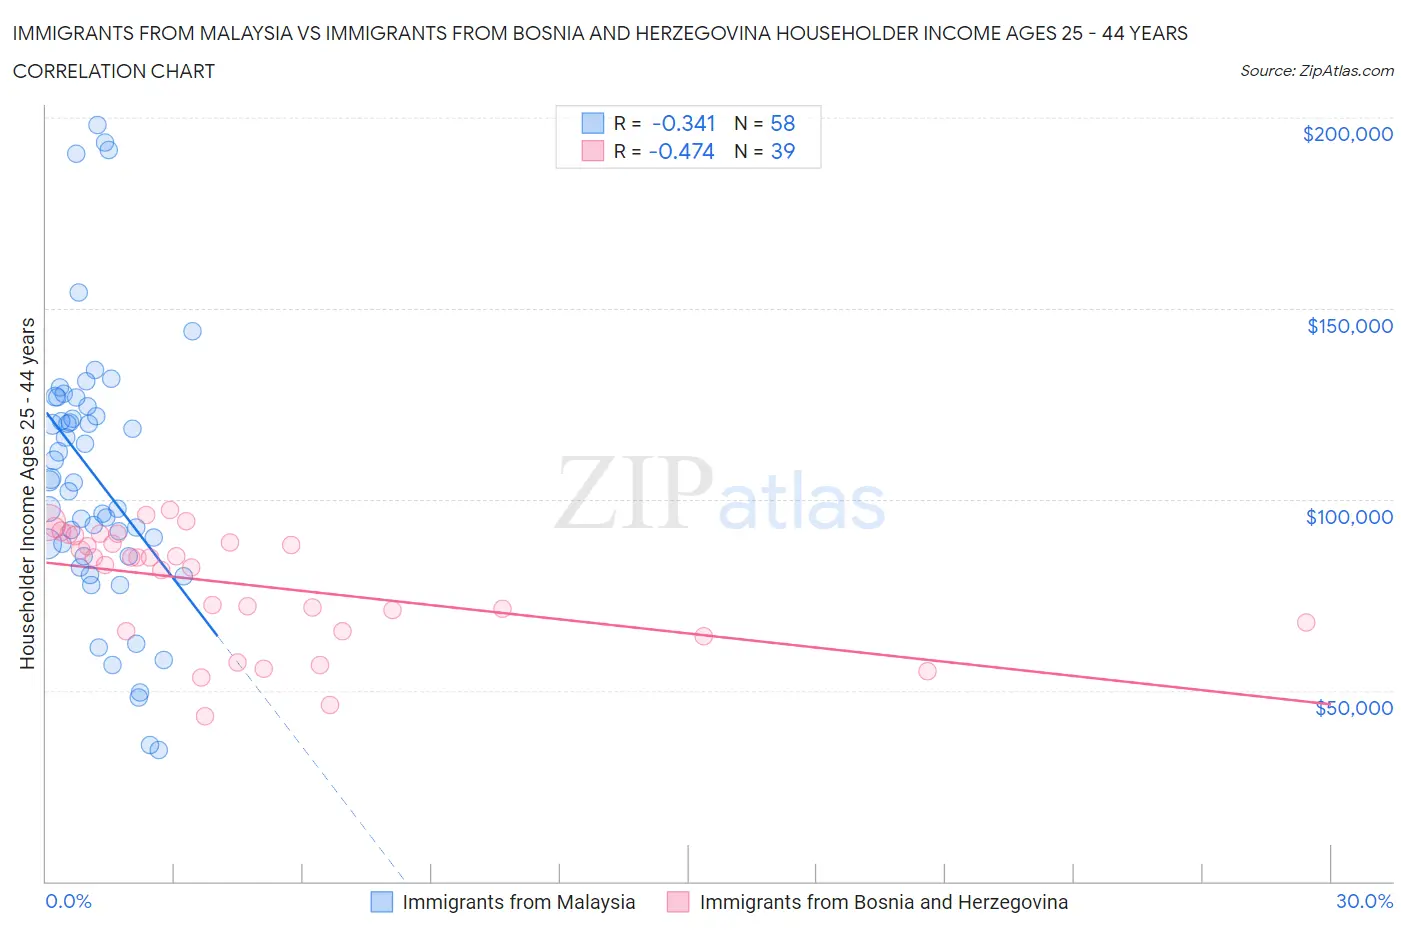
Immigrants from Malaysia vs Immigrants from Bosnia and Herzegovina Householder Income Ages 25 - 44 years Correlation Chart
The statistical analysis conducted on geographies consisting of 197,845,248 people shows a mild negative correlation between the proportion of Immigrants from Malaysia and household income with householder between the ages 25 and 44 in the United States with a correlation coefficient (R) of -0.341 and weighted average of $107,650. Similarly, the statistical analysis conducted on geographies consisting of 156,745,458 people shows a moderate negative correlation between the proportion of Immigrants from Bosnia and Herzegovina and household income with householder between the ages 25 and 44 in the United States with a correlation coefficient (R) of -0.474 and weighted average of $88,819, a difference of 21.2%.
Householder Income Ages 25 - 44 years Correlation Summary
| Measurement | Immigrants from Malaysia | Immigrants from Bosnia and Herzegovina |
| Minimum | $34,268 | $43,125 |
| Maximum | $197,953 | $97,331 |
| Range | $163,685 | $54,206 |
| Mean | $106,093 | $77,653 |
| Median | $104,675 | $84,682 |
| Interquartile 25% (IQ1) | $85,164 | $65,598 |
| Interquartile 75% (IQ3) | $124,430 | $90,547 |
| Interquartile Range (IQR) | $39,265 | $24,949 |
| Standard Deviation (Sample) | $35,722 | $15,061 |
| Standard Deviation (Population) | $35,413 | $14,867 |
Similar Demographics by Householder Income Ages 25 - 44 years
Demographics Similar to Immigrants from Malaysia by Householder Income Ages 25 - 44 years
In terms of householder income ages 25 - 44 years, the demographic groups most similar to Immigrants from Malaysia are Immigrants from Indonesia ($107,627, a difference of 0.020%), Israeli ($107,579, a difference of 0.070%), Australian ($107,912, a difference of 0.24%), Immigrants from Belarus ($107,393, a difference of 0.24%), and Estonian ($107,269, a difference of 0.36%).
| Demographics | Rating | Rank | Householder Income Ages 25 - 44 years |
| Latvians | 100.0 /100 | #36 | Exceptional $108,926 |
| Immigrants | Russia | 100.0 /100 | #37 | Exceptional $108,751 |
| Soviet Union | 100.0 /100 | #38 | Exceptional $108,457 |
| Immigrants | France | 99.9 /100 | #39 | Exceptional $108,257 |
| Immigrants | Lithuania | 99.9 /100 | #40 | Exceptional $108,149 |
| Immigrants | Bolivia | 99.9 /100 | #41 | Exceptional $108,128 |
| Australians | 99.9 /100 | #42 | Exceptional $107,912 |
| Immigrants | Malaysia | 99.9 /100 | #43 | Exceptional $107,650 |
| Immigrants | Indonesia | 99.9 /100 | #44 | Exceptional $107,627 |
| Israelis | 99.9 /100 | #45 | Exceptional $107,579 |
| Immigrants | Belarus | 99.9 /100 | #46 | Exceptional $107,393 |
| Estonians | 99.9 /100 | #47 | Exceptional $107,269 |
| Bulgarians | 99.9 /100 | #48 | Exceptional $107,264 |
| Immigrants | Turkey | 99.9 /100 | #49 | Exceptional $107,258 |
| Cambodians | 99.9 /100 | #50 | Exceptional $107,148 |
Demographics Similar to Immigrants from Bosnia and Herzegovina by Householder Income Ages 25 - 44 years
In terms of householder income ages 25 - 44 years, the demographic groups most similar to Immigrants from Bosnia and Herzegovina are Immigrants from St. Vincent and the Grenadines ($88,888, a difference of 0.080%), Immigrants from Barbados ($88,687, a difference of 0.15%), Alaskan Athabascan ($88,446, a difference of 0.42%), Immigrants from Grenada ($88,311, a difference of 0.58%), and Nonimmigrants ($88,301, a difference of 0.59%).
| Demographics | Rating | Rank | Householder Income Ages 25 - 44 years |
| Immigrants | Trinidad and Tobago | 6.5 /100 | #221 | Tragic $89,748 |
| Immigrants | Ecuador | 6.2 /100 | #222 | Tragic $89,673 |
| Immigrants | Guyana | 5.9 /100 | #223 | Tragic $89,586 |
| Barbadians | 5.9 /100 | #224 | Tragic $89,565 |
| Immigrants | Panama | 5.5 /100 | #225 | Tragic $89,451 |
| Immigrants | Iraq | 5.5 /100 | #226 | Tragic $89,444 |
| Immigrants | St. Vincent and the Grenadines | 4.1 /100 | #227 | Tragic $88,888 |
| Immigrants | Bosnia and Herzegovina | 4.0 /100 | #228 | Tragic $88,819 |
| Immigrants | Barbados | 3.7 /100 | #229 | Tragic $88,687 |
| Alaskan Athabascans | 3.3 /100 | #230 | Tragic $88,446 |
| Immigrants | Grenada | 3.0 /100 | #231 | Tragic $88,311 |
| Immigrants | Nonimmigrants | 3.0 /100 | #232 | Tragic $88,301 |
| Malaysians | 3.0 /100 | #233 | Tragic $88,291 |
| Venezuelans | 2.9 /100 | #234 | Tragic $88,232 |
| Bermudans | 2.9 /100 | #235 | Tragic $88,231 |