European vs Tlingit-Haida Per Capita Income
COMPARE
European
Tlingit-Haida
Per Capita Income
Per Capita Income Comparison
Europeans
Tlingit-Haida
$45,836
PER CAPITA INCOME
92.0/ 100
METRIC RATING
124th/ 347
METRIC RANK
$43,516
PER CAPITA INCOME
45.9/ 100
METRIC RATING
177th/ 347
METRIC RANK
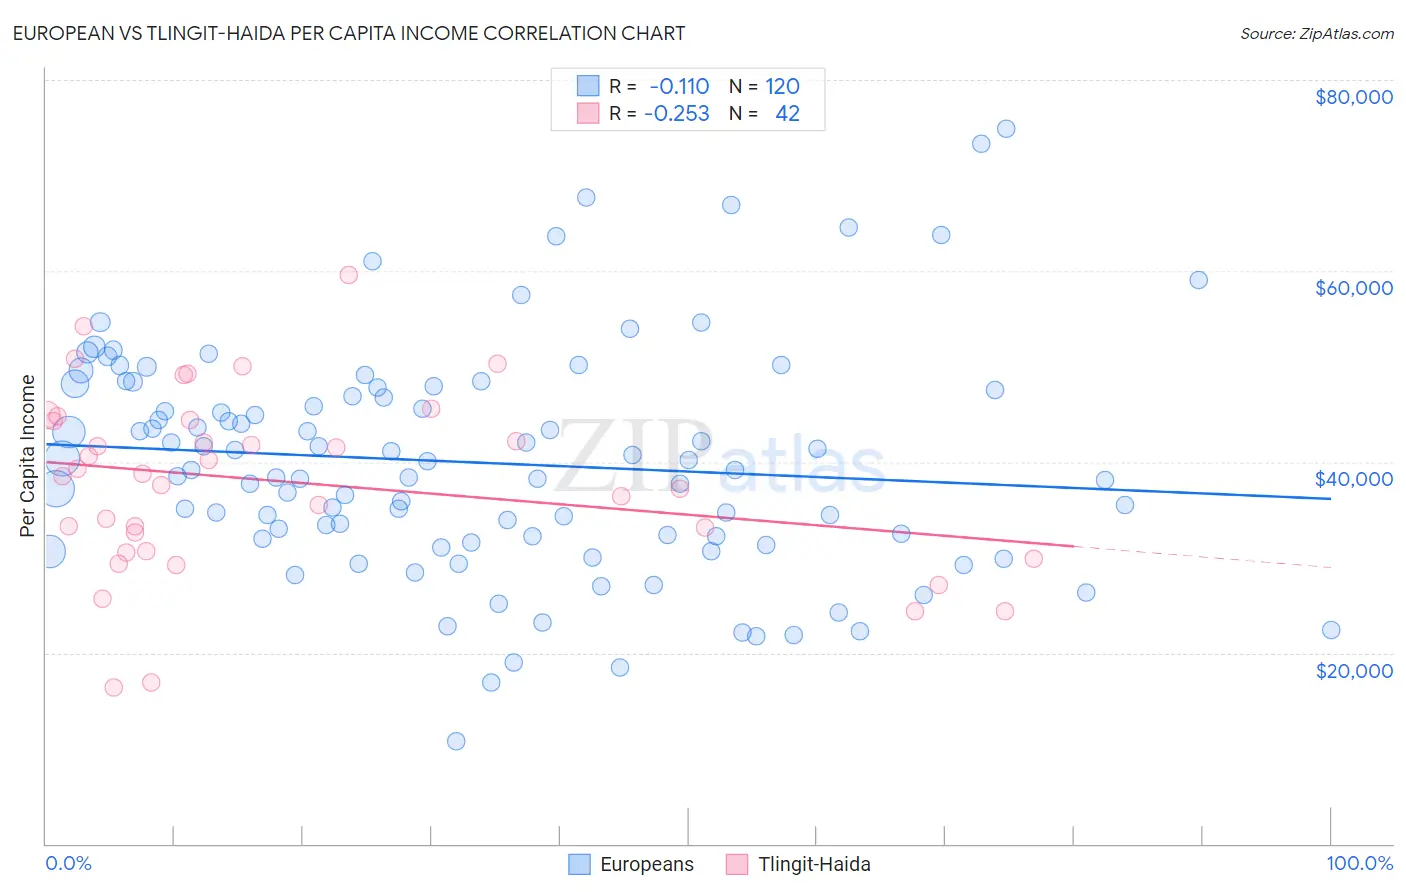
European vs Tlingit-Haida Per Capita Income Correlation Chart
The statistical analysis conducted on geographies consisting of 561,881,498 people shows a poor negative correlation between the proportion of Europeans and per capita income in the United States with a correlation coefficient (R) of -0.110 and weighted average of $45,836. Similarly, the statistical analysis conducted on geographies consisting of 60,872,339 people shows a weak negative correlation between the proportion of Tlingit-Haida and per capita income in the United States with a correlation coefficient (R) of -0.253 and weighted average of $43,516, a difference of 5.3%.
Per Capita Income Correlation Summary
| Measurement | European | Tlingit-Haida |
| Minimum | $10,710 | $16,326 |
| Maximum | $74,913 | $59,619 |
| Range | $64,203 | $43,293 |
| Mean | $39,928 | $37,894 |
| Median | $39,188 | $38,682 |
| Interquartile 25% (IQ1) | $32,091 | $30,599 |
| Interquartile 75% (IQ3) | $47,667 | $44,372 |
| Interquartile Range (IQR) | $15,576 | $13,773 |
| Standard Deviation (Sample) | $11,966 | $9,586 |
| Standard Deviation (Population) | $11,916 | $9,471 |
Similar Demographics by Per Capita Income
Demographics Similar to Europeans by Per Capita Income
In terms of per capita income, the demographic groups most similar to Europeans are Lebanese ($45,840, a difference of 0.010%), Moroccan ($45,854, a difference of 0.040%), Canadian ($45,858, a difference of 0.050%), Zimbabwean ($45,804, a difference of 0.070%), and Palestinian ($45,790, a difference of 0.10%).
| Demographics | Rating | Rank | Per Capita Income |
| Chinese | 93.9 /100 | #117 | Exceptional $46,098 |
| Immigrants | Saudi Arabia | 93.3 /100 | #118 | Exceptional $46,008 |
| Immigrants | Poland | 93.1 /100 | #119 | Exceptional $45,979 |
| Immigrants | Ethiopia | 92.7 /100 | #120 | Exceptional $45,923 |
| Canadians | 92.2 /100 | #121 | Exceptional $45,858 |
| Moroccans | 92.1 /100 | #122 | Exceptional $45,854 |
| Lebanese | 92.0 /100 | #123 | Exceptional $45,840 |
| Europeans | 92.0 /100 | #124 | Exceptional $45,836 |
| Zimbabweans | 91.7 /100 | #125 | Exceptional $45,804 |
| Palestinians | 91.6 /100 | #126 | Exceptional $45,790 |
| Immigrants | Germany | 91.3 /100 | #127 | Exceptional $45,751 |
| Swedes | 91.3 /100 | #128 | Exceptional $45,750 |
| Luxembourgers | 90.4 /100 | #129 | Exceptional $45,663 |
| Arabs | 90.4 /100 | #130 | Exceptional $45,662 |
| Immigrants | North Macedonia | 90.0 /100 | #131 | Exceptional $45,622 |
Demographics Similar to Tlingit-Haida by Per Capita Income
In terms of per capita income, the demographic groups most similar to Tlingit-Haida are Immigrants from South Eastern Asia ($43,539, a difference of 0.050%), Immigrants from Costa Rica ($43,464, a difference of 0.12%), Finnish ($43,461, a difference of 0.13%), Celtic ($43,621, a difference of 0.24%), and Sierra Leonean ($43,405, a difference of 0.25%).
| Demographics | Rating | Rank | Per Capita Income |
| Scandinavians | 55.2 /100 | #170 | Average $43,848 |
| Immigrants | Eastern Africa | 54.9 /100 | #171 | Average $43,838 |
| Czechoslovakians | 54.1 /100 | #172 | Average $43,806 |
| French | 50.7 /100 | #173 | Average $43,685 |
| Colombians | 50.0 /100 | #174 | Average $43,661 |
| Celtics | 48.9 /100 | #175 | Average $43,621 |
| Immigrants | South Eastern Asia | 46.6 /100 | #176 | Average $43,539 |
| Tlingit-Haida | 45.9 /100 | #177 | Average $43,516 |
| Immigrants | Costa Rica | 44.5 /100 | #178 | Average $43,464 |
| Finns | 44.4 /100 | #179 | Average $43,461 |
| Sierra Leoneans | 42.9 /100 | #180 | Average $43,405 |
| Welsh | 38.2 /100 | #181 | Fair $43,233 |
| Immigrants | Vietnam | 38.1 /100 | #182 | Fair $43,229 |
| Germans | 33.9 /100 | #183 | Fair $43,067 |
| Spaniards | 32.9 /100 | #184 | Fair $43,028 |