Immigrants from Sierra Leone vs Tlingit-Haida Per Capita Income
COMPARE
Immigrants from Sierra Leone
Tlingit-Haida
Per Capita Income
Per Capita Income Comparison
Immigrants from Sierra Leone
Tlingit-Haida
$42,752
PER CAPITA INCOME
26.5/ 100
METRIC RATING
193rd/ 347
METRIC RANK
$43,516
PER CAPITA INCOME
45.9/ 100
METRIC RATING
177th/ 347
METRIC RANK
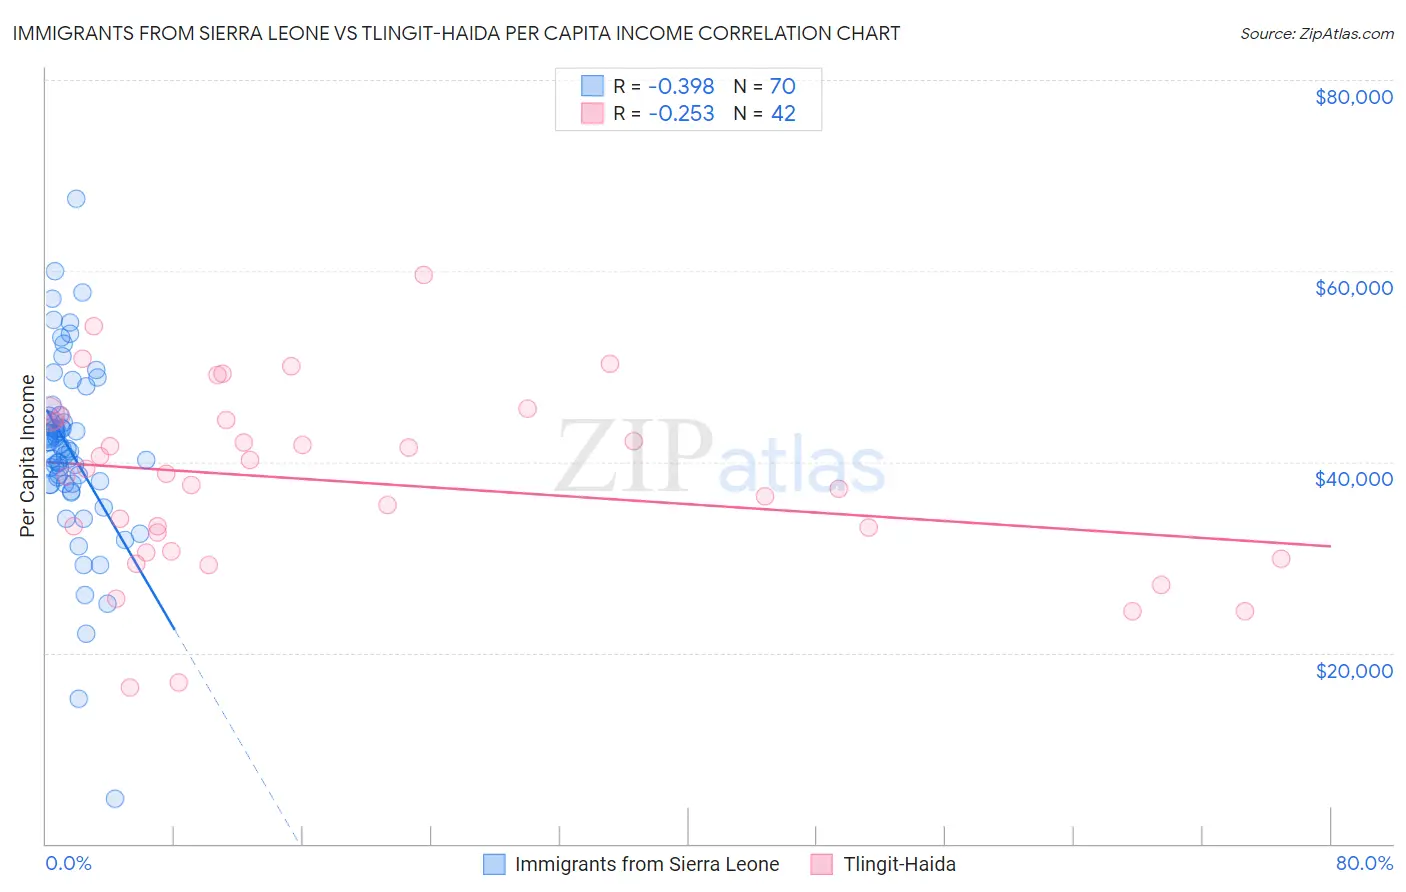
Immigrants from Sierra Leone vs Tlingit-Haida Per Capita Income Correlation Chart
The statistical analysis conducted on geographies consisting of 101,626,660 people shows a mild negative correlation between the proportion of Immigrants from Sierra Leone and per capita income in the United States with a correlation coefficient (R) of -0.398 and weighted average of $42,752. Similarly, the statistical analysis conducted on geographies consisting of 60,872,339 people shows a weak negative correlation between the proportion of Tlingit-Haida and per capita income in the United States with a correlation coefficient (R) of -0.253 and weighted average of $43,516, a difference of 1.8%.
Per Capita Income Correlation Summary
| Measurement | Immigrants from Sierra Leone | Tlingit-Haida |
| Minimum | $4,657 | $16,326 |
| Maximum | $67,610 | $59,619 |
| Range | $62,953 | $43,293 |
| Mean | $41,186 | $37,894 |
| Median | $41,327 | $38,682 |
| Interquartile 25% (IQ1) | $37,712 | $30,599 |
| Interquartile 75% (IQ3) | $44,823 | $44,372 |
| Interquartile Range (IQR) | $7,111 | $13,773 |
| Standard Deviation (Sample) | $9,754 | $9,586 |
| Standard Deviation (Population) | $9,684 | $9,471 |
Demographics Similar to Immigrants from Sierra Leone and Tlingit-Haida by Per Capita Income
In terms of per capita income, the demographic groups most similar to Immigrants from Sierra Leone are Iraqi ($42,760, a difference of 0.020%), Yugoslavian ($42,792, a difference of 0.090%), Kenyan ($42,808, a difference of 0.13%), Immigrants from Fiji ($42,694, a difference of 0.13%), and Immigrants from Kenya ($42,661, a difference of 0.21%). Similarly, the demographic groups most similar to Tlingit-Haida are Immigrants from South Eastern Asia ($43,539, a difference of 0.050%), Immigrants from Costa Rica ($43,464, a difference of 0.12%), Finnish ($43,461, a difference of 0.13%), Celtic ($43,621, a difference of 0.24%), and Sierra Leonean ($43,405, a difference of 0.25%).
| Demographics | Rating | Rank | Per Capita Income |
| Celtics | 48.9 /100 | #175 | Average $43,621 |
| Immigrants | South Eastern Asia | 46.6 /100 | #176 | Average $43,539 |
| Tlingit-Haida | 45.9 /100 | #177 | Average $43,516 |
| Immigrants | Costa Rica | 44.5 /100 | #178 | Average $43,464 |
| Finns | 44.4 /100 | #179 | Average $43,461 |
| Sierra Leoneans | 42.9 /100 | #180 | Average $43,405 |
| Welsh | 38.2 /100 | #181 | Fair $43,233 |
| Immigrants | Vietnam | 38.1 /100 | #182 | Fair $43,229 |
| Germans | 33.9 /100 | #183 | Fair $43,067 |
| Spaniards | 32.9 /100 | #184 | Fair $43,028 |
| Immigrants | Immigrants | 32.5 /100 | #185 | Fair $43,010 |
| French Canadians | 32.3 /100 | #186 | Fair $43,003 |
| Immigrants | Colombia | 31.5 /100 | #187 | Fair $42,971 |
| Immigrants | Africa | 31.0 /100 | #188 | Fair $42,950 |
| Bermudans | 30.1 /100 | #189 | Fair $42,911 |
| Kenyans | 27.7 /100 | #190 | Fair $42,808 |
| Yugoslavians | 27.4 /100 | #191 | Fair $42,792 |
| Iraqis | 26.7 /100 | #192 | Fair $42,760 |
| Immigrants | Sierra Leone | 26.5 /100 | #193 | Fair $42,752 |
| Immigrants | Fiji | 25.2 /100 | #194 | Fair $42,694 |
| Immigrants | Kenya | 24.5 /100 | #195 | Fair $42,661 |