Yaqui vs Immigrants from Costa Rica Median Earnings
COMPARE
Yaqui
Immigrants from Costa Rica
Median Earnings
Median Earnings Comparison
Yaqui
Immigrants from Costa Rica
$40,647
MEDIAN EARNINGS
0.0/ 100
METRIC RATING
306th/ 347
METRIC RANK
$45,928
MEDIAN EARNINGS
33.0/ 100
METRIC RATING
194th/ 347
METRIC RANK
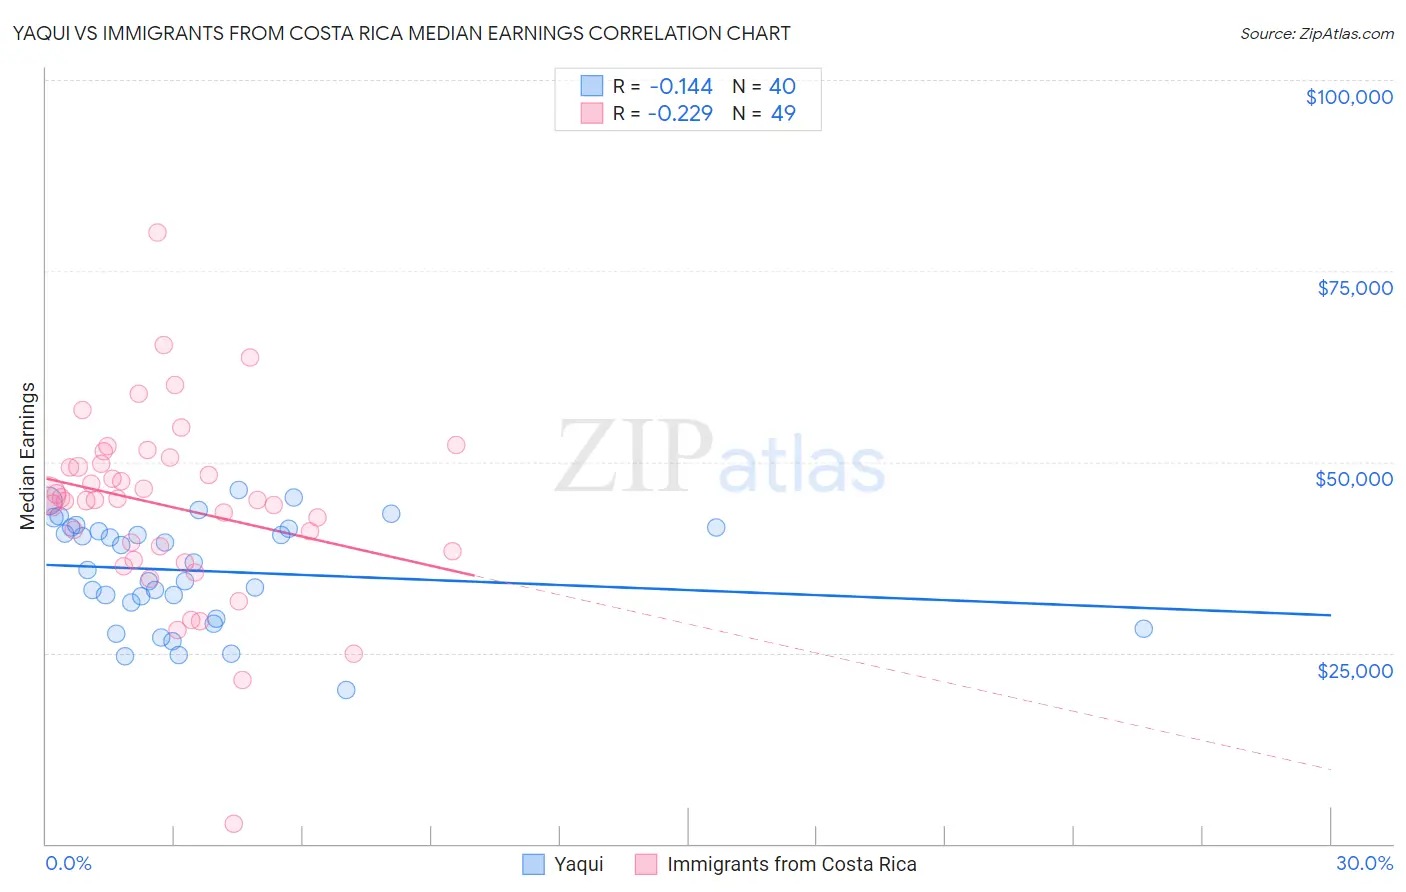
Yaqui vs Immigrants from Costa Rica Median Earnings Correlation Chart
The statistical analysis conducted on geographies consisting of 107,736,593 people shows a poor negative correlation between the proportion of Yaqui and median earnings in the United States with a correlation coefficient (R) of -0.144 and weighted average of $40,647. Similarly, the statistical analysis conducted on geographies consisting of 204,262,782 people shows a weak negative correlation between the proportion of Immigrants from Costa Rica and median earnings in the United States with a correlation coefficient (R) of -0.229 and weighted average of $45,928, a difference of 13.0%.
Median Earnings Correlation Summary
| Measurement | Yaqui | Immigrants from Costa Rica |
| Minimum | $20,058 | $2,615 |
| Maximum | $46,273 | $80,083 |
| Range | $26,215 | $77,468 |
| Mean | $35,713 | $44,180 |
| Median | $36,396 | $45,027 |
| Interquartile 25% (IQ1) | $30,515 | $37,709 |
| Interquartile 75% (IQ3) | $41,344 | $50,100 |
| Interquartile Range (IQR) | $10,829 | $12,390 |
| Standard Deviation (Sample) | $6,900 | $12,240 |
| Standard Deviation (Population) | $6,813 | $12,114 |
Similar Demographics by Median Earnings
Demographics Similar to Yaqui by Median Earnings
In terms of median earnings, the demographic groups most similar to Yaqui are Honduran ($40,638, a difference of 0.020%), Chickasaw ($40,672, a difference of 0.060%), Cuban ($40,619, a difference of 0.070%), Immigrants from Haiti ($40,550, a difference of 0.24%), and Immigrants from Guatemala ($40,851, a difference of 0.50%).
| Demographics | Rating | Rank | Median Earnings |
| Immigrants | Caribbean | 0.1 /100 | #299 | Tragic $41,119 |
| Ute | 0.1 /100 | #300 | Tragic $41,051 |
| Immigrants | Latin America | 0.1 /100 | #301 | Tragic $41,049 |
| Shoshone | 0.0 /100 | #302 | Tragic $40,932 |
| Haitians | 0.0 /100 | #303 | Tragic $40,918 |
| Immigrants | Guatemala | 0.0 /100 | #304 | Tragic $40,851 |
| Chickasaw | 0.0 /100 | #305 | Tragic $40,672 |
| Yaqui | 0.0 /100 | #306 | Tragic $40,647 |
| Hondurans | 0.0 /100 | #307 | Tragic $40,638 |
| Cubans | 0.0 /100 | #308 | Tragic $40,619 |
| Immigrants | Haiti | 0.0 /100 | #309 | Tragic $40,550 |
| Apache | 0.0 /100 | #310 | Tragic $40,388 |
| Hispanics or Latinos | 0.0 /100 | #311 | Tragic $40,288 |
| Chippewa | 0.0 /100 | #312 | Tragic $40,287 |
| Choctaw | 0.0 /100 | #313 | Tragic $40,270 |
Demographics Similar to Immigrants from Costa Rica by Median Earnings
In terms of median earnings, the demographic groups most similar to Immigrants from Costa Rica are Guamanian/Chamorro ($45,933, a difference of 0.010%), German ($45,935, a difference of 0.020%), Finnish ($45,940, a difference of 0.030%), Immigrants from St. Vincent and the Grenadines ($45,908, a difference of 0.040%), and Yugoslavian ($45,846, a difference of 0.18%).
| Demographics | Rating | Rank | Median Earnings |
| Iraqis | 39.9 /100 | #187 | Fair $46,140 |
| Immigrants | Armenia | 38.3 /100 | #188 | Fair $46,094 |
| Spaniards | 37.2 /100 | #189 | Fair $46,059 |
| French Canadians | 36.1 /100 | #190 | Fair $46,026 |
| Finns | 33.4 /100 | #191 | Fair $45,940 |
| Germans | 33.2 /100 | #192 | Fair $45,935 |
| Guamanians/Chamorros | 33.2 /100 | #193 | Fair $45,933 |
| Immigrants | Costa Rica | 33.0 /100 | #194 | Fair $45,928 |
| Immigrants | St. Vincent and the Grenadines | 32.4 /100 | #195 | Fair $45,908 |
| Yugoslavians | 30.5 /100 | #196 | Fair $45,846 |
| Barbadians | 30.5 /100 | #197 | Fair $45,846 |
| Trinidadians and Tobagonians | 29.7 /100 | #198 | Fair $45,820 |
| Immigrants | Barbados | 29.6 /100 | #199 | Fair $45,816 |
| Immigrants | Azores | 29.5 /100 | #200 | Fair $45,812 |
| Celtics | 27.2 /100 | #201 | Fair $45,732 |