Belizean vs Alaskan Athabascan Median Household Income
COMPARE
Belizean
Alaskan Athabascan
Median Household Income
Median Household Income Comparison
Belizeans
Alaskan Athabascans
$77,028
MEDIAN HOUSEHOLD INCOME
0.6/ 100
METRIC RATING
256th/ 347
METRIC RANK
$76,383
MEDIAN HOUSEHOLD INCOME
0.4/ 100
METRIC RATING
263rd/ 347
METRIC RANK
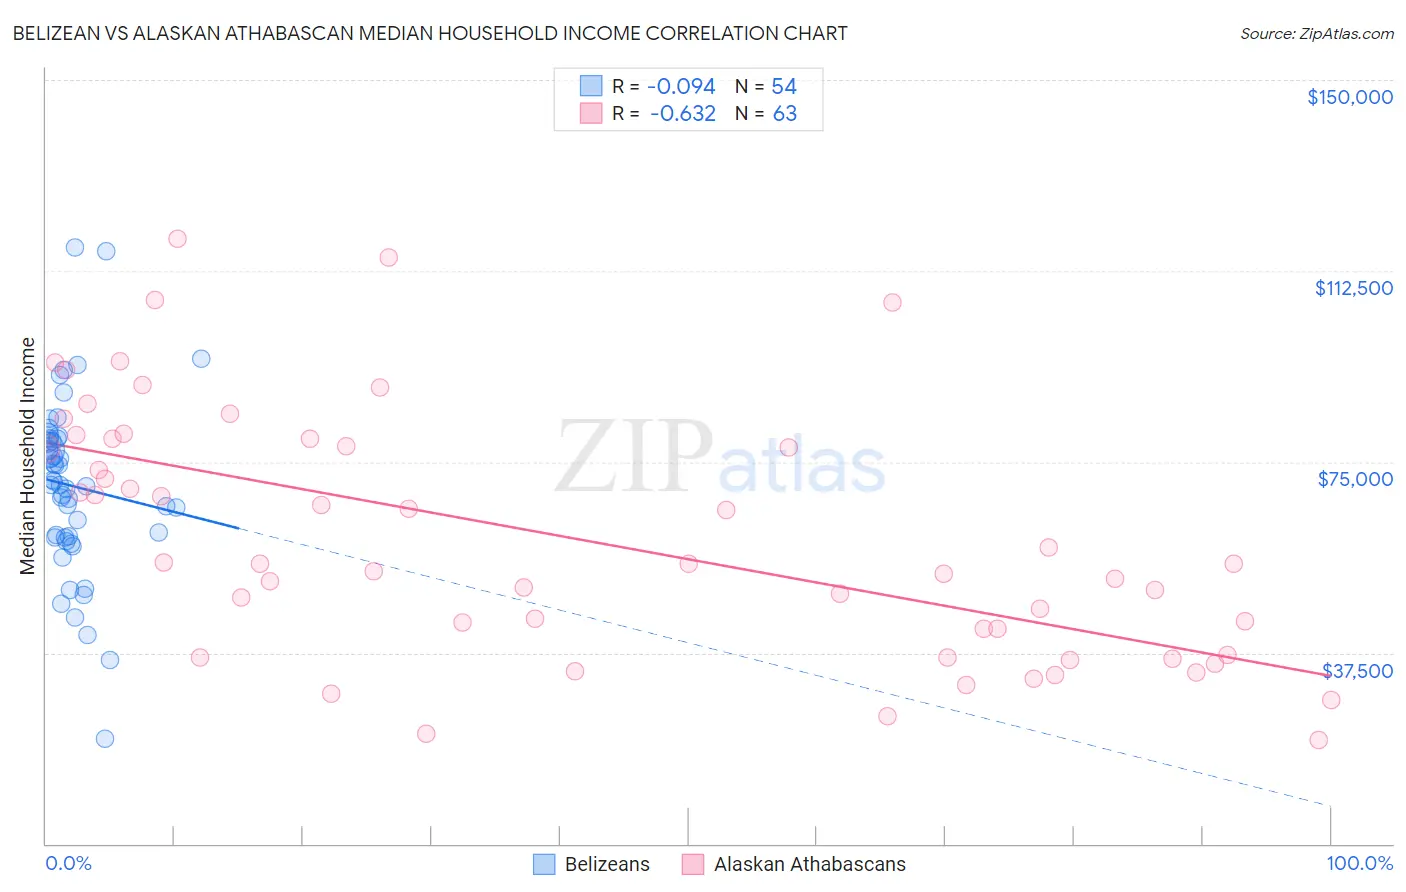
Belizean vs Alaskan Athabascan Median Household Income Correlation Chart
The statistical analysis conducted on geographies consisting of 144,146,880 people shows a slight negative correlation between the proportion of Belizeans and median household income in the United States with a correlation coefficient (R) of -0.094 and weighted average of $77,028. Similarly, the statistical analysis conducted on geographies consisting of 45,812,420 people shows a significant negative correlation between the proportion of Alaskan Athabascans and median household income in the United States with a correlation coefficient (R) of -0.632 and weighted average of $76,383, a difference of 0.84%.
Median Household Income Correlation Summary
| Measurement | Belizean | Alaskan Athabascan |
| Minimum | $20,723 | $20,417 |
| Maximum | $117,113 | $118,934 |
| Range | $96,390 | $98,517 |
| Mean | $70,224 | $60,171 |
| Median | $70,434 | $55,000 |
| Interquartile 25% (IQ1) | $60,138 | $36,964 |
| Interquartile 75% (IQ3) | $79,527 | $79,438 |
| Interquartile Range (IQR) | $19,389 | $42,474 |
| Standard Deviation (Sample) | $17,495 | $24,397 |
| Standard Deviation (Population) | $17,332 | $24,203 |
Demographics Similar to Belizeans and Alaskan Athabascans by Median Household Income
In terms of median household income, the demographic groups most similar to Belizeans are Immigrants from Senegal ($76,915, a difference of 0.15%), Immigrants from Nicaragua ($76,784, a difference of 0.32%), Spanish American Indian ($76,670, a difference of 0.47%), Jamaican ($76,583, a difference of 0.58%), and Immigrants from Grenada ($76,517, a difference of 0.67%). Similarly, the demographic groups most similar to Alaskan Athabascans are French American Indian ($76,387, a difference of 0.010%), Immigrants from Grenada ($76,517, a difference of 0.18%), Jamaican ($76,583, a difference of 0.26%), Spanish American Indian ($76,670, a difference of 0.38%), and Immigrants from Nicaragua ($76,784, a difference of 0.52%).
| Demographics | Rating | Rank | Median Household Income |
| West Indians | 1.4 /100 | #249 | Tragic $78,455 |
| Immigrants | Laos | 1.3 /100 | #250 | Tragic $78,327 |
| Mexican American Indians | 1.2 /100 | #251 | Tragic $78,166 |
| Immigrants | West Indies | 1.0 /100 | #252 | Tragic $77,956 |
| Immigrants | St. Vincent and the Grenadines | 0.9 /100 | #253 | Tragic $77,690 |
| Sub-Saharan Africans | 0.8 /100 | #254 | Tragic $77,631 |
| Immigrants | Middle Africa | 0.8 /100 | #255 | Tragic $77,559 |
| Belizeans | 0.6 /100 | #256 | Tragic $77,028 |
| Immigrants | Senegal | 0.5 /100 | #257 | Tragic $76,915 |
| Immigrants | Nicaragua | 0.5 /100 | #258 | Tragic $76,784 |
| Spanish American Indians | 0.4 /100 | #259 | Tragic $76,670 |
| Jamaicans | 0.4 /100 | #260 | Tragic $76,583 |
| Immigrants | Grenada | 0.4 /100 | #261 | Tragic $76,517 |
| French American Indians | 0.4 /100 | #262 | Tragic $76,387 |
| Alaskan Athabascans | 0.4 /100 | #263 | Tragic $76,383 |
| Guatemalans | 0.3 /100 | #264 | Tragic $75,961 |
| Immigrants | Belize | 0.3 /100 | #265 | Tragic $75,938 |
| Americans | 0.3 /100 | #266 | Tragic $75,932 |
| German Russians | 0.3 /100 | #267 | Tragic $75,856 |
| Immigrants | Jamaica | 0.3 /100 | #268 | Tragic $75,851 |
| Cape Verdeans | 0.3 /100 | #269 | Tragic $75,848 |