Immigrants from Yemen vs Alaskan Athabascan Median Household Income
COMPARE
Immigrants from Yemen
Alaskan Athabascan
Median Household Income
Median Household Income Comparison
Immigrants from Yemen
Alaskan Athabascans
$65,194
MEDIAN HOUSEHOLD INCOME
0.0/ 100
METRIC RATING
338th/ 347
METRIC RANK
$76,383
MEDIAN HOUSEHOLD INCOME
0.4/ 100
METRIC RATING
263rd/ 347
METRIC RANK
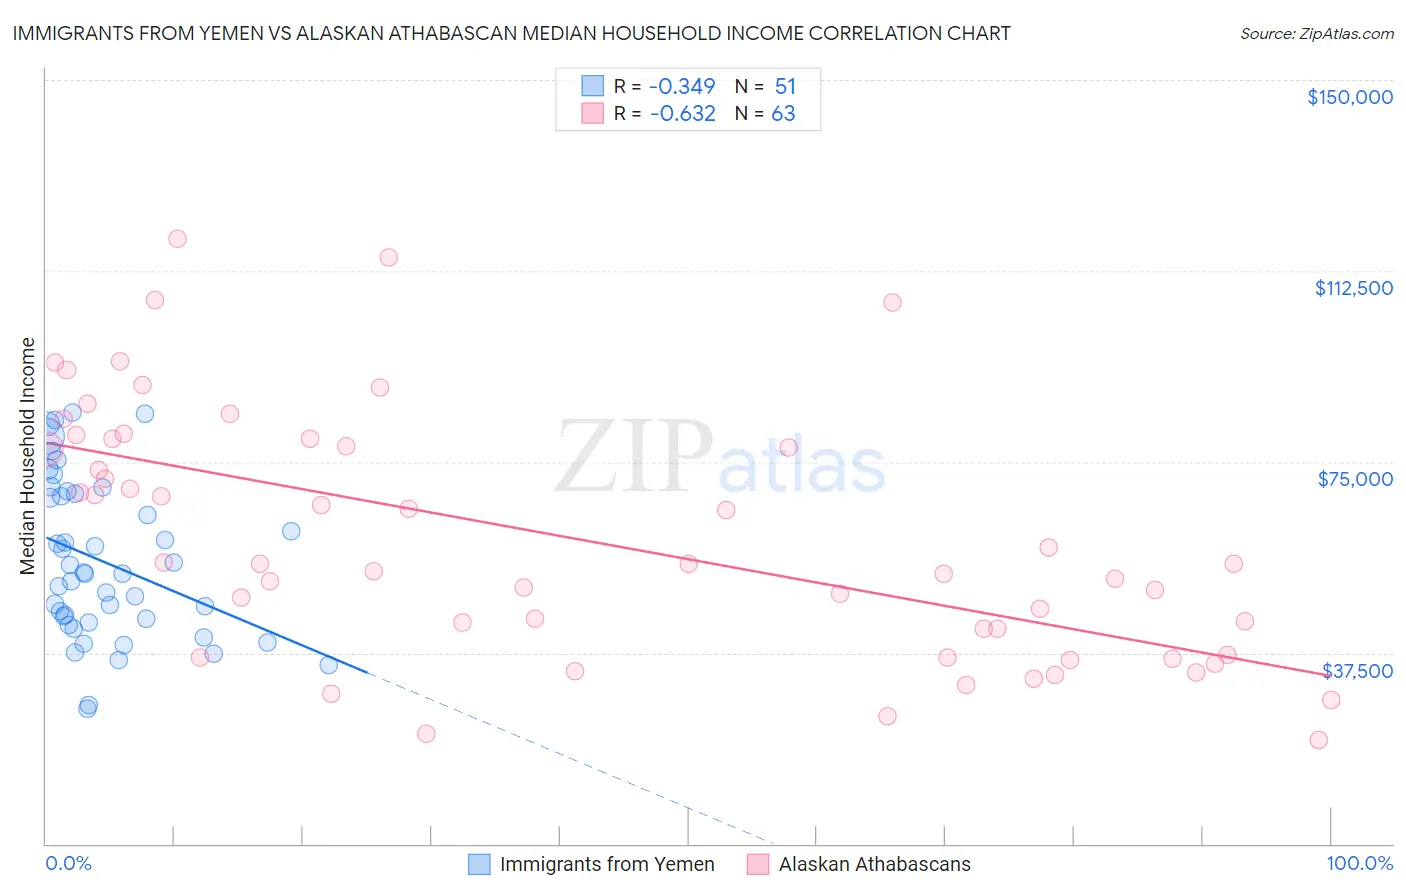
Immigrants from Yemen vs Alaskan Athabascan Median Household Income Correlation Chart
The statistical analysis conducted on geographies consisting of 82,433,611 people shows a mild negative correlation between the proportion of Immigrants from Yemen and median household income in the United States with a correlation coefficient (R) of -0.349 and weighted average of $65,194. Similarly, the statistical analysis conducted on geographies consisting of 45,812,420 people shows a significant negative correlation between the proportion of Alaskan Athabascans and median household income in the United States with a correlation coefficient (R) of -0.632 and weighted average of $76,383, a difference of 17.2%.
Median Household Income Correlation Summary
| Measurement | Immigrants from Yemen | Alaskan Athabascan |
| Minimum | $26,635 | $20,417 |
| Maximum | $84,689 | $118,934 |
| Range | $58,054 | $98,517 |
| Mean | $55,369 | $60,171 |
| Median | $53,125 | $55,000 |
| Interquartile 25% (IQ1) | $43,348 | $36,964 |
| Interquartile 75% (IQ3) | $68,707 | $79,438 |
| Interquartile Range (IQR) | $25,359 | $42,474 |
| Standard Deviation (Sample) | $15,452 | $24,397 |
| Standard Deviation (Population) | $15,299 | $24,203 |
Similar Demographics by Median Household Income
Demographics Similar to Immigrants from Yemen by Median Household Income
In terms of median household income, the demographic groups most similar to Immigrants from Yemen are Hopi ($65,043, a difference of 0.23%), Pueblo ($64,692, a difference of 0.78%), Kiowa ($65,914, a difference of 1.1%), Crow ($63,681, a difference of 2.4%), and Immigrants from Congo ($66,768, a difference of 2.4%).
| Demographics | Rating | Rank | Median Household Income |
| Natives/Alaskans | 0.0 /100 | #331 | Tragic $67,879 |
| Sioux | 0.0 /100 | #332 | Tragic $67,792 |
| Creek | 0.0 /100 | #333 | Tragic $67,715 |
| Blacks/African Americans | 0.0 /100 | #334 | Tragic $67,573 |
| Cheyenne | 0.0 /100 | #335 | Tragic $66,974 |
| Immigrants | Congo | 0.0 /100 | #336 | Tragic $66,768 |
| Kiowa | 0.0 /100 | #337 | Tragic $65,914 |
| Immigrants | Yemen | 0.0 /100 | #338 | Tragic $65,194 |
| Hopi | 0.0 /100 | #339 | Tragic $65,043 |
| Pueblo | 0.0 /100 | #340 | Tragic $64,692 |
| Crow | 0.0 /100 | #341 | Tragic $63,681 |
| Pima | 0.0 /100 | #342 | Tragic $63,262 |
| Houma | 0.0 /100 | #343 | Tragic $62,575 |
| Tohono O'odham | 0.0 /100 | #344 | Tragic $61,663 |
| Puerto Ricans | 0.0 /100 | #345 | Tragic $59,197 |
Demographics Similar to Alaskan Athabascans by Median Household Income
In terms of median household income, the demographic groups most similar to Alaskan Athabascans are French American Indian ($76,387, a difference of 0.010%), Immigrants from Grenada ($76,517, a difference of 0.18%), Jamaican ($76,583, a difference of 0.26%), Spanish American Indian ($76,670, a difference of 0.38%), and Immigrants from Nicaragua ($76,784, a difference of 0.52%).
| Demographics | Rating | Rank | Median Household Income |
| Belizeans | 0.6 /100 | #256 | Tragic $77,028 |
| Immigrants | Senegal | 0.5 /100 | #257 | Tragic $76,915 |
| Immigrants | Nicaragua | 0.5 /100 | #258 | Tragic $76,784 |
| Spanish American Indians | 0.4 /100 | #259 | Tragic $76,670 |
| Jamaicans | 0.4 /100 | #260 | Tragic $76,583 |
| Immigrants | Grenada | 0.4 /100 | #261 | Tragic $76,517 |
| French American Indians | 0.4 /100 | #262 | Tragic $76,387 |
| Alaskan Athabascans | 0.4 /100 | #263 | Tragic $76,383 |
| Guatemalans | 0.3 /100 | #264 | Tragic $75,961 |
| Immigrants | Belize | 0.3 /100 | #265 | Tragic $75,938 |
| Americans | 0.3 /100 | #266 | Tragic $75,932 |
| German Russians | 0.3 /100 | #267 | Tragic $75,856 |
| Immigrants | Jamaica | 0.3 /100 | #268 | Tragic $75,851 |
| Cape Verdeans | 0.3 /100 | #269 | Tragic $75,848 |
| Hmong | 0.3 /100 | #270 | Tragic $75,839 |