Pakistani vs Immigrants from Western Asia Householder Income Ages 25 - 44 years
COMPARE
Pakistani
Immigrants from Western Asia
Householder Income Ages 25 - 44 years
Householder Income Ages 25 - 44 years Comparison
Pakistanis
Immigrants from Western Asia
$98,401
HOUSEHOLDER INCOME AGES 25 - 44 YEARS
89.3/ 100
METRIC RATING
125th/ 347
METRIC RANK
$99,516
HOUSEHOLDER INCOME AGES 25 - 44 YEARS
94.0/ 100
METRIC RATING
114th/ 347
METRIC RANK
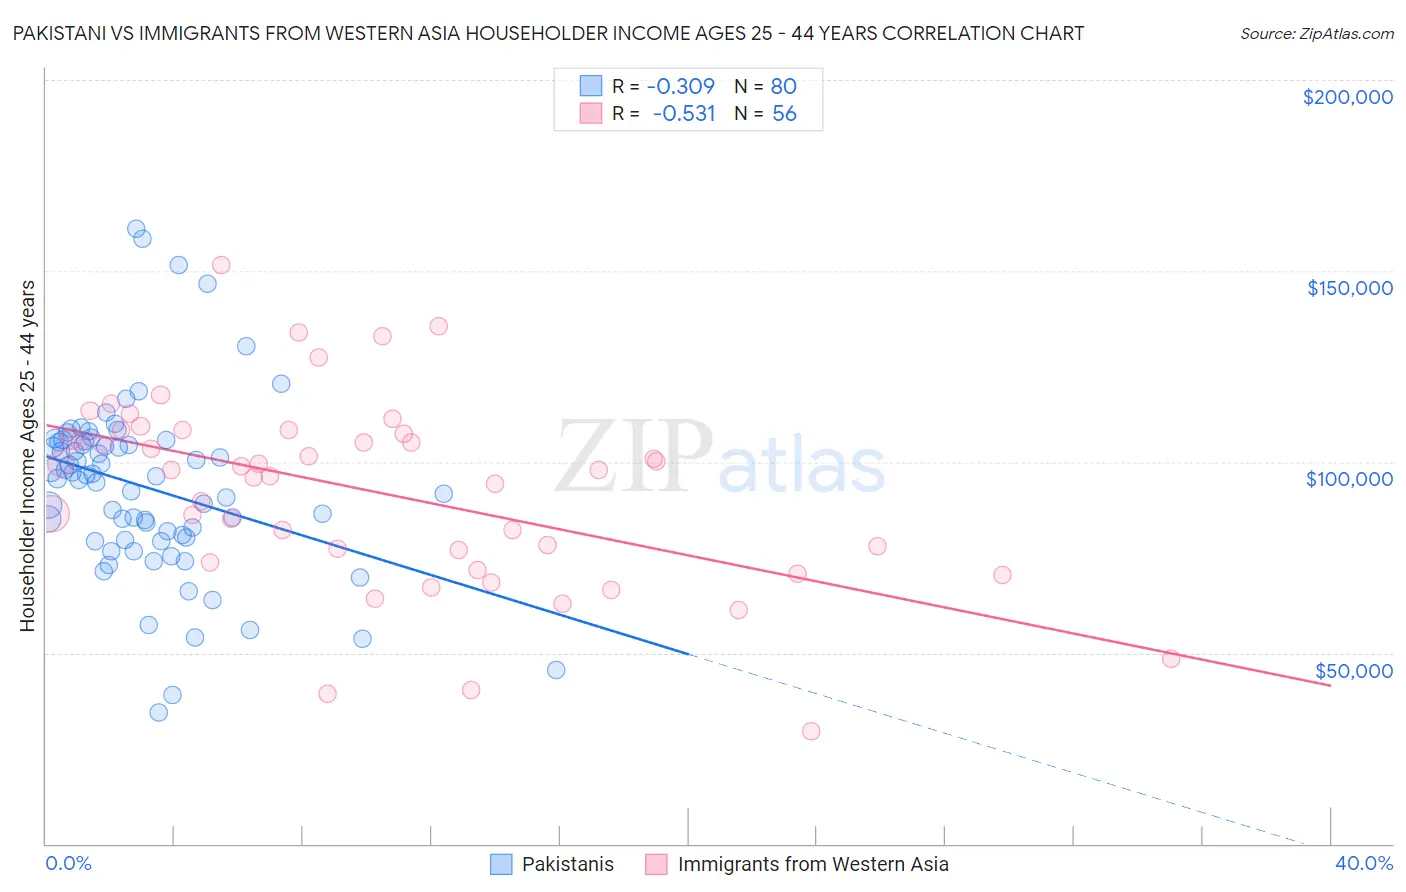
Pakistani vs Immigrants from Western Asia Householder Income Ages 25 - 44 years Correlation Chart
The statistical analysis conducted on geographies consisting of 334,652,075 people shows a mild negative correlation between the proportion of Pakistanis and household income with householder between the ages 25 and 44 in the United States with a correlation coefficient (R) of -0.309 and weighted average of $98,401. Similarly, the statistical analysis conducted on geographies consisting of 403,414,437 people shows a substantial negative correlation between the proportion of Immigrants from Western Asia and household income with householder between the ages 25 and 44 in the United States with a correlation coefficient (R) of -0.531 and weighted average of $99,516, a difference of 1.1%.
Householder Income Ages 25 - 44 years Correlation Summary
| Measurement | Pakistani | Immigrants from Western Asia |
| Minimum | $34,363 | $29,492 |
| Maximum | $161,157 | $151,438 |
| Range | $126,794 | $121,946 |
| Mean | $93,256 | $92,165 |
| Median | $95,924 | $97,998 |
| Interquartile 25% (IQ1) | $79,748 | $75,153 |
| Interquartile 75% (IQ3) | $105,308 | $107,722 |
| Interquartile Range (IQR) | $25,561 | $32,569 |
| Standard Deviation (Sample) | $23,370 | $24,816 |
| Standard Deviation (Population) | $23,224 | $24,593 |
Demographics Similar to Pakistanis and Immigrants from Western Asia by Householder Income Ages 25 - 44 years
In terms of householder income ages 25 - 44 years, the demographic groups most similar to Pakistanis are British ($98,359, a difference of 0.040%), Serbian ($98,320, a difference of 0.080%), European ($98,310, a difference of 0.090%), Brazilian ($98,267, a difference of 0.14%), and Zimbabwean ($98,586, a difference of 0.19%). Similarly, the demographic groups most similar to Immigrants from Western Asia are Carpatho Rusyn ($99,449, a difference of 0.070%), Tongan ($99,604, a difference of 0.090%), Portuguese ($99,429, a difference of 0.090%), Polish ($99,685, a difference of 0.17%), and Immigrants from Northern Africa ($99,232, a difference of 0.29%).
| Demographics | Rating | Rank | Householder Income Ages 25 - 44 years |
| Immigrants | North Macedonia | 95.6 /100 | #109 | Exceptional $100,101 |
| Immigrants | Afghanistan | 95.3 /100 | #110 | Exceptional $99,977 |
| Chileans | 95.1 /100 | #111 | Exceptional $99,900 |
| Poles | 94.5 /100 | #112 | Exceptional $99,685 |
| Tongans | 94.2 /100 | #113 | Exceptional $99,604 |
| Immigrants | Western Asia | 94.0 /100 | #114 | Exceptional $99,516 |
| Carpatho Rusyns | 93.7 /100 | #115 | Exceptional $99,449 |
| Portuguese | 93.7 /100 | #116 | Exceptional $99,429 |
| Immigrants | Northern Africa | 93.0 /100 | #117 | Exceptional $99,232 |
| Syrians | 92.9 /100 | #118 | Exceptional $99,215 |
| Jordanians | 92.8 /100 | #119 | Exceptional $99,186 |
| Swedes | 92.7 /100 | #120 | Exceptional $99,136 |
| Peruvians | 91.7 /100 | #121 | Exceptional $98,886 |
| Immigrants | Uzbekistan | 91.5 /100 | #122 | Exceptional $98,849 |
| Palestinians | 91.2 /100 | #123 | Exceptional $98,777 |
| Zimbabweans | 90.3 /100 | #124 | Exceptional $98,586 |
| Pakistanis | 89.3 /100 | #125 | Excellent $98,401 |
| British | 89.1 /100 | #126 | Excellent $98,359 |
| Serbians | 88.9 /100 | #127 | Excellent $98,320 |
| Europeans | 88.9 /100 | #128 | Excellent $98,310 |
| Brazilians | 88.6 /100 | #129 | Excellent $98,267 |