West Indian vs Immigrants from Dominica Householder Income Ages 25 - 44 years
COMPARE
West Indian
Immigrants from Dominica
Householder Income Ages 25 - 44 years
Householder Income Ages 25 - 44 years Comparison
West Indians
Immigrants from Dominica
$87,205
HOUSEHOLDER INCOME AGES 25 - 44 YEARS
1.7/ 100
METRIC RATING
242nd/ 347
METRIC RANK
$81,351
HOUSEHOLDER INCOME AGES 25 - 44 YEARS
0.1/ 100
METRIC RATING
296th/ 347
METRIC RANK
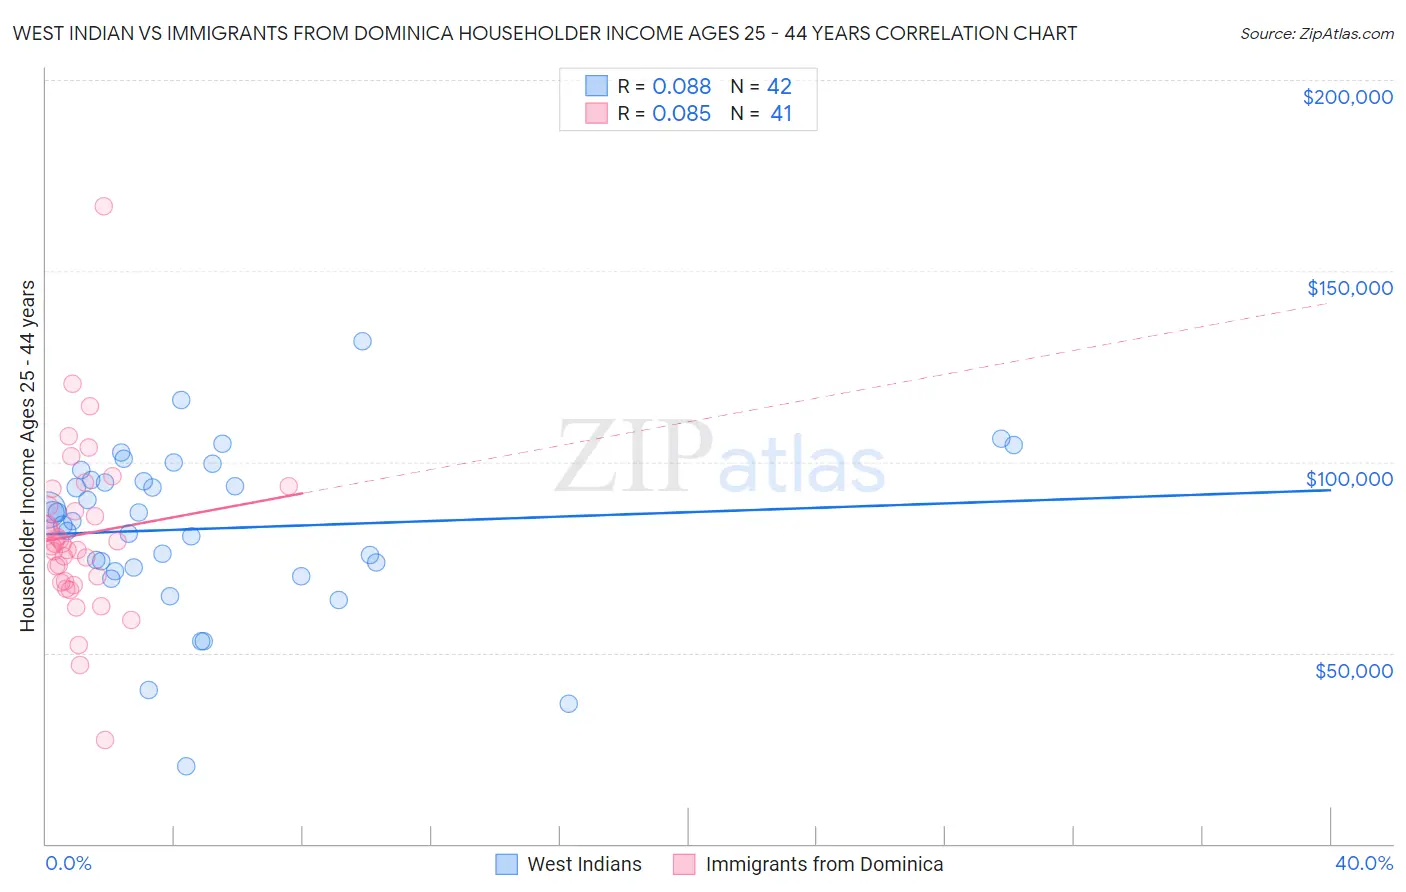
West Indian vs Immigrants from Dominica Householder Income Ages 25 - 44 years Correlation Chart
The statistical analysis conducted on geographies consisting of 253,630,243 people shows a slight positive correlation between the proportion of West Indians and household income with householder between the ages 25 and 44 in the United States with a correlation coefficient (R) of 0.088 and weighted average of $87,205. Similarly, the statistical analysis conducted on geographies consisting of 83,772,470 people shows a slight positive correlation between the proportion of Immigrants from Dominica and household income with householder between the ages 25 and 44 in the United States with a correlation coefficient (R) of 0.085 and weighted average of $81,351, a difference of 7.2%.
Householder Income Ages 25 - 44 years Correlation Summary
| Measurement | West Indian | Immigrants from Dominica |
| Minimum | $20,234 | $27,269 |
| Maximum | $131,705 | $167,054 |
| Range | $111,471 | $139,785 |
| Mean | $82,528 | $80,956 |
| Median | $85,571 | $78,585 |
| Interquartile 25% (IQ1) | $72,417 | $68,699 |
| Interquartile 75% (IQ3) | $95,404 | $90,712 |
| Interquartile Range (IQR) | $22,987 | $22,013 |
| Standard Deviation (Sample) | $21,318 | $22,322 |
| Standard Deviation (Population) | $21,063 | $22,048 |
Similar Demographics by Householder Income Ages 25 - 44 years
Demographics Similar to West Indians by Householder Income Ages 25 - 44 years
In terms of householder income ages 25 - 44 years, the demographic groups most similar to West Indians are Immigrants from West Indies ($87,063, a difference of 0.16%), Immigrants from Venezuela ($87,038, a difference of 0.19%), Immigrants from El Salvador ($86,913, a difference of 0.34%), Immigrants from Burma/Myanmar ($86,736, a difference of 0.54%), and Nigerian ($87,730, a difference of 0.60%).
| Demographics | Rating | Rank | Householder Income Ages 25 - 44 years |
| Bermudans | 2.9 /100 | #235 | Tragic $88,231 |
| Immigrants | Cameroon | 2.9 /100 | #236 | Tragic $88,214 |
| Salvadorans | 2.8 /100 | #237 | Tragic $88,198 |
| Alaska Natives | 2.6 /100 | #238 | Tragic $88,018 |
| Immigrants | Ghana | 2.2 /100 | #239 | Tragic $87,760 |
| Nicaraguans | 2.2 /100 | #240 | Tragic $87,751 |
| Nigerians | 2.2 /100 | #241 | Tragic $87,730 |
| West Indians | 1.7 /100 | #242 | Tragic $87,205 |
| Immigrants | West Indies | 1.5 /100 | #243 | Tragic $87,063 |
| Immigrants | Venezuela | 1.5 /100 | #244 | Tragic $87,038 |
| Immigrants | El Salvador | 1.4 /100 | #245 | Tragic $86,913 |
| Immigrants | Burma/Myanmar | 1.3 /100 | #246 | Tragic $86,736 |
| Immigrants | Nigeria | 1.2 /100 | #247 | Tragic $86,589 |
| Immigrants | Sudan | 0.9 /100 | #248 | Tragic $86,109 |
| French American Indians | 0.8 /100 | #249 | Tragic $85,899 |
Demographics Similar to Immigrants from Dominica by Householder Income Ages 25 - 44 years
In terms of householder income ages 25 - 44 years, the demographic groups most similar to Immigrants from Dominica are Immigrants from Guatemala ($81,341, a difference of 0.010%), Bangladeshi ($81,363, a difference of 0.020%), Dominican ($81,229, a difference of 0.15%), Cuban ($81,483, a difference of 0.16%), and Blackfeet ($81,531, a difference of 0.22%).
| Demographics | Rating | Rank | Householder Income Ages 25 - 44 years |
| Shoshone | 0.1 /100 | #289 | Tragic $82,062 |
| Liberians | 0.1 /100 | #290 | Tragic $82,005 |
| Potawatomi | 0.1 /100 | #291 | Tragic $81,774 |
| Yaqui | 0.1 /100 | #292 | Tragic $81,656 |
| Blackfeet | 0.1 /100 | #293 | Tragic $81,531 |
| Cubans | 0.1 /100 | #294 | Tragic $81,483 |
| Bangladeshis | 0.1 /100 | #295 | Tragic $81,363 |
| Immigrants | Dominica | 0.1 /100 | #296 | Tragic $81,351 |
| Immigrants | Guatemala | 0.1 /100 | #297 | Tragic $81,341 |
| Dominicans | 0.1 /100 | #298 | Tragic $81,229 |
| Immigrants | Liberia | 0.1 /100 | #299 | Tragic $80,863 |
| Cherokee | 0.0 /100 | #300 | Tragic $80,843 |
| Immigrants | Micronesia | 0.0 /100 | #301 | Tragic $80,544 |
| Hispanics or Latinos | 0.0 /100 | #302 | Tragic $80,515 |
| Mexicans | 0.0 /100 | #303 | Tragic $80,427 |