Norwegian vs Hmong Median Family Income
COMPARE
Norwegian
Hmong
Median Family Income
Median Family Income Comparison
Norwegians
Hmong
$106,144
MEDIAN FAMILY INCOME
85.5/ 100
METRIC RATING
140th/ 347
METRIC RANK
$91,296
MEDIAN FAMILY INCOME
0.3/ 100
METRIC RATING
265th/ 347
METRIC RANK
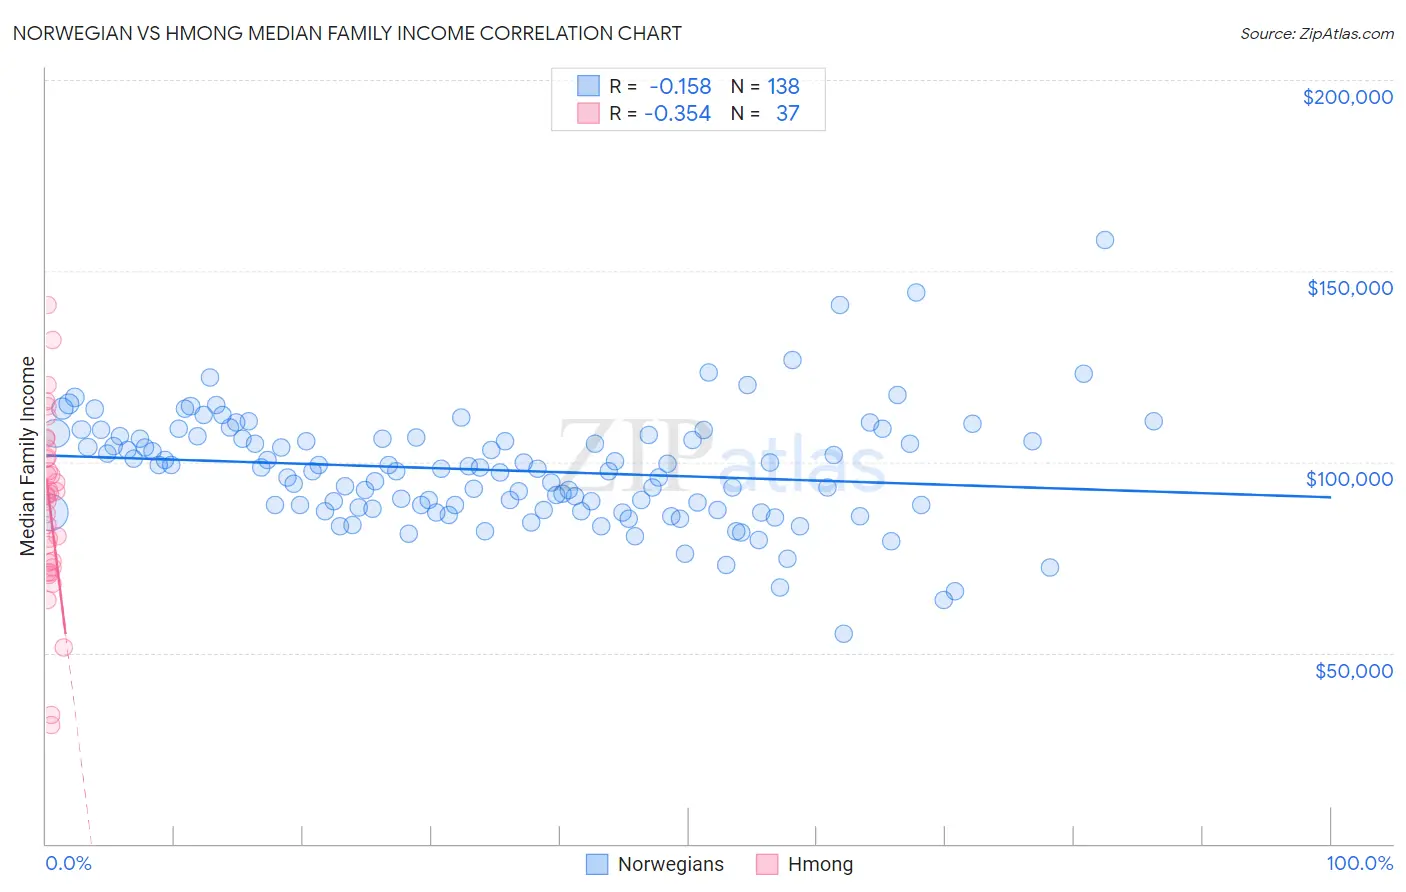
Norwegian vs Hmong Median Family Income Correlation Chart
The statistical analysis conducted on geographies consisting of 532,482,890 people shows a poor negative correlation between the proportion of Norwegians and median family income in the United States with a correlation coefficient (R) of -0.158 and weighted average of $106,144. Similarly, the statistical analysis conducted on geographies consisting of 24,655,529 people shows a mild negative correlation between the proportion of Hmong and median family income in the United States with a correlation coefficient (R) of -0.354 and weighted average of $91,296, a difference of 16.3%.
Median Family Income Correlation Summary
| Measurement | Norwegian | Hmong |
| Minimum | $55,000 | $31,056 |
| Maximum | $158,125 | $141,078 |
| Range | $103,125 | $110,022 |
| Mean | $97,803 | $88,552 |
| Median | $98,173 | $91,363 |
| Interquartile 25% (IQ1) | $87,829 | $73,027 |
| Interquartile 75% (IQ3) | $106,302 | $102,409 |
| Interquartile Range (IQR) | $18,473 | $29,382 |
| Standard Deviation (Sample) | $14,847 | $23,412 |
| Standard Deviation (Population) | $14,793 | $23,093 |
Similar Demographics by Median Family Income
Demographics Similar to Norwegians by Median Family Income
In terms of median family income, the demographic groups most similar to Norwegians are Immigrants from Syria ($106,118, a difference of 0.020%), Immigrants from Uganda ($106,188, a difference of 0.040%), Immigrants from Vietnam ($106,186, a difference of 0.040%), Luxembourger ($106,183, a difference of 0.040%), and Immigrants from South Eastern Asia ($106,252, a difference of 0.10%).
| Demographics | Rating | Rank | Median Family Income |
| Ugandans | 87.8 /100 | #133 | Excellent $106,541 |
| Immigrants | Oceania | 87.3 /100 | #134 | Excellent $106,453 |
| Portuguese | 86.3 /100 | #135 | Excellent $106,286 |
| Immigrants | South Eastern Asia | 86.1 /100 | #136 | Excellent $106,252 |
| Immigrants | Uganda | 85.7 /100 | #137 | Excellent $106,188 |
| Immigrants | Vietnam | 85.7 /100 | #138 | Excellent $106,186 |
| Luxembourgers | 85.7 /100 | #139 | Excellent $106,183 |
| Norwegians | 85.5 /100 | #140 | Excellent $106,144 |
| Immigrants | Syria | 85.3 /100 | #141 | Excellent $106,118 |
| Slovenes | 84.7 /100 | #142 | Excellent $106,020 |
| Tongans | 84.3 /100 | #143 | Excellent $105,967 |
| Immigrants | Morocco | 84.3 /100 | #144 | Excellent $105,964 |
| Danes | 83.8 /100 | #145 | Excellent $105,900 |
| Czechs | 83.4 /100 | #146 | Excellent $105,839 |
| Immigrants | Chile | 82.1 /100 | #147 | Excellent $105,655 |
Demographics Similar to Hmong by Median Family Income
In terms of median family income, the demographic groups most similar to Hmong are Senegalese ($91,475, a difference of 0.20%), Central American ($91,087, a difference of 0.23%), Immigrants from West Indies ($91,588, a difference of 0.32%), Mexican American Indian ($90,918, a difference of 0.42%), and Cree ($90,882, a difference of 0.46%).
| Demographics | Rating | Rank | Median Family Income |
| Osage | 0.4 /100 | #258 | Tragic $91,926 |
| Cape Verdeans | 0.4 /100 | #259 | Tragic $91,848 |
| Pennsylvania Germans | 0.4 /100 | #260 | Tragic $91,763 |
| Inupiat | 0.4 /100 | #261 | Tragic $91,730 |
| Liberians | 0.4 /100 | #262 | Tragic $91,722 |
| Immigrants | West Indies | 0.3 /100 | #263 | Tragic $91,588 |
| Senegalese | 0.3 /100 | #264 | Tragic $91,475 |
| Hmong | 0.3 /100 | #265 | Tragic $91,296 |
| Central Americans | 0.3 /100 | #266 | Tragic $91,087 |
| Mexican American Indians | 0.2 /100 | #267 | Tragic $90,918 |
| Cree | 0.2 /100 | #268 | Tragic $90,882 |
| Belizeans | 0.2 /100 | #269 | Tragic $90,880 |
| Jamaicans | 0.2 /100 | #270 | Tragic $90,581 |
| Iroquois | 0.2 /100 | #271 | Tragic $90,543 |
| Immigrants | Liberia | 0.2 /100 | #272 | Tragic $90,450 |