Venezuelan vs Houma Median Female Earnings
COMPARE
Venezuelan
Houma
Median Female Earnings
Median Female Earnings Comparison
Venezuelans
Houma
$37,282
MEDIAN FEMALE EARNINGS
0.7/ 100
METRIC RATING
262nd/ 347
METRIC RANK
$30,343
MEDIAN FEMALE EARNINGS
0.0/ 100
METRIC RATING
347th/ 347
METRIC RANK
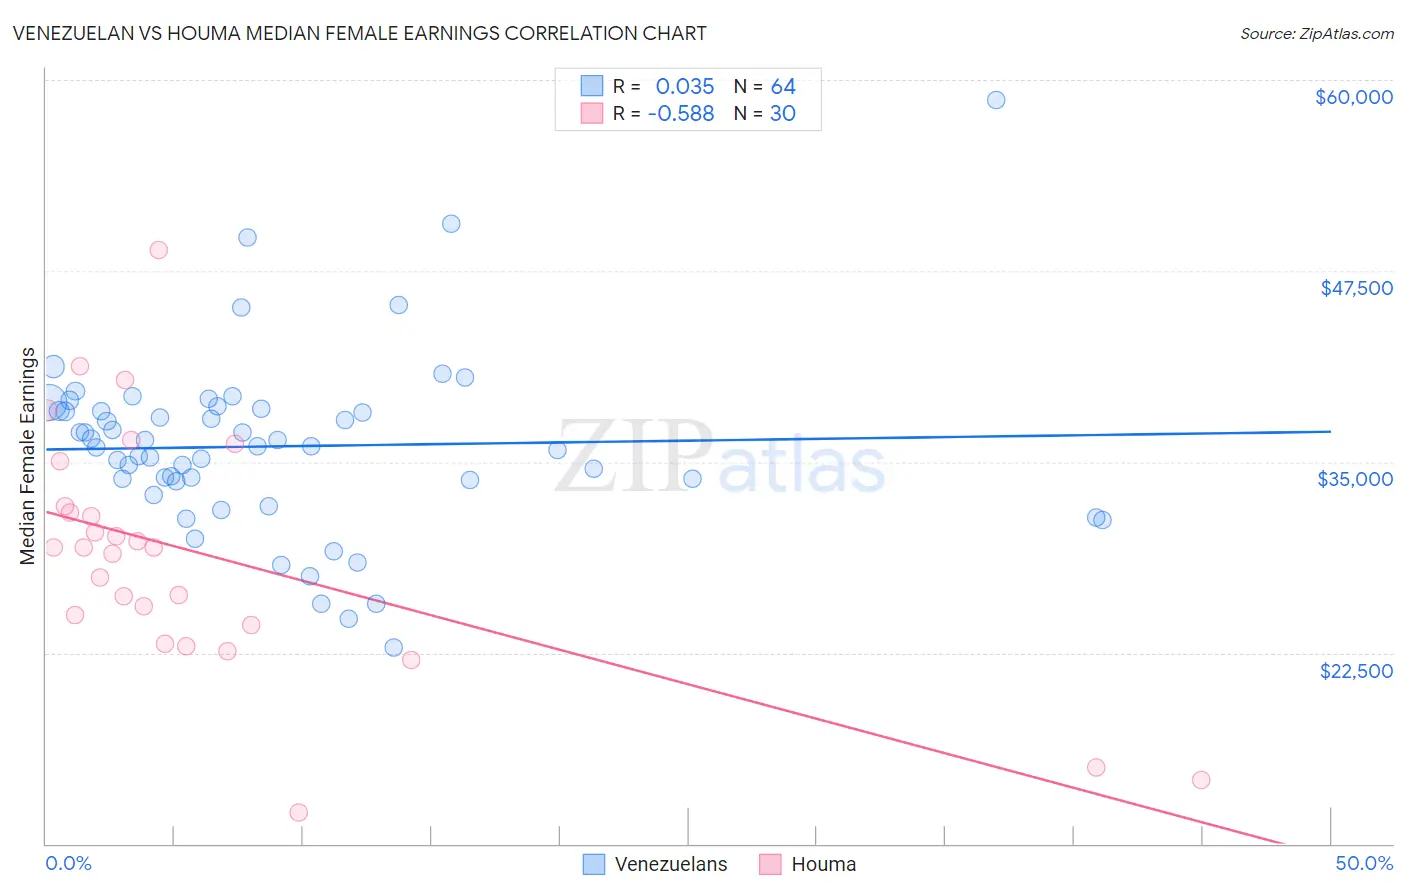
Venezuelan vs Houma Median Female Earnings Correlation Chart
The statistical analysis conducted on geographies consisting of 306,258,851 people shows no correlation between the proportion of Venezuelans and median female earnings in the United States with a correlation coefficient (R) of 0.035 and weighted average of $37,282. Similarly, the statistical analysis conducted on geographies consisting of 36,795,297 people shows a substantial negative correlation between the proportion of Houma and median female earnings in the United States with a correlation coefficient (R) of -0.588 and weighted average of $30,343, a difference of 22.9%.
Median Female Earnings Correlation Summary
| Measurement | Venezuelan | Houma |
| Minimum | $22,864 | $12,038 |
| Maximum | $58,709 | $48,900 |
| Range | $35,845 | $36,862 |
| Mean | $36,013 | $28,868 |
| Median | $36,008 | $29,403 |
| Interquartile 25% (IQ1) | $33,765 | $24,292 |
| Interquartile 75% (IQ3) | $38,398 | $32,114 |
| Interquartile Range (IQR) | $4,633 | $7,822 |
| Standard Deviation (Sample) | $5,910 | $8,016 |
| Standard Deviation (Population) | $5,863 | $7,881 |
Similar Demographics by Median Female Earnings
Demographics Similar to Venezuelans by Median Female Earnings
In terms of median female earnings, the demographic groups most similar to Venezuelans are Malaysian ($37,298, a difference of 0.040%), Dutch ($37,339, a difference of 0.15%), Scotch-Irish ($37,383, a difference of 0.27%), Belizean ($37,429, a difference of 0.39%), and German Russian ($37,105, a difference of 0.48%).
| Demographics | Rating | Rank | Median Female Earnings |
| Colville | 1.1 /100 | #255 | Tragic $37,514 |
| Samoans | 1.0 /100 | #256 | Tragic $37,498 |
| Hawaiians | 1.0 /100 | #257 | Tragic $37,497 |
| Belizeans | 0.9 /100 | #258 | Tragic $37,429 |
| Scotch-Irish | 0.8 /100 | #259 | Tragic $37,383 |
| Dutch | 0.7 /100 | #260 | Tragic $37,339 |
| Malaysians | 0.7 /100 | #261 | Tragic $37,298 |
| Venezuelans | 0.7 /100 | #262 | Tragic $37,282 |
| German Russians | 0.5 /100 | #263 | Tragic $37,105 |
| Salvadorans | 0.4 /100 | #264 | Tragic $37,083 |
| Immigrants | Belize | 0.4 /100 | #265 | Tragic $37,056 |
| Dominicans | 0.4 /100 | #266 | Tragic $37,046 |
| Immigrants | Nonimmigrants | 0.4 /100 | #267 | Tragic $37,024 |
| Cree | 0.4 /100 | #268 | Tragic $37,018 |
| Immigrants | Venezuela | 0.4 /100 | #269 | Tragic $37,003 |
Demographics Similar to Houma by Median Female Earnings
In terms of median female earnings, the demographic groups most similar to Houma are Arapaho ($31,489, a difference of 3.8%), Puerto Rican ($31,560, a difference of 4.0%), Lumbee ($32,500, a difference of 7.1%), Pueblo ($32,564, a difference of 7.3%), and Yup'ik ($32,730, a difference of 7.9%).
| Demographics | Rating | Rank | Median Female Earnings |
| Mexicans | 0.0 /100 | #333 | Tragic $33,664 |
| Spanish American Indians | 0.0 /100 | #334 | Tragic $33,625 |
| Creek | 0.0 /100 | #335 | Tragic $33,437 |
| Ottawa | 0.0 /100 | #336 | Tragic $33,378 |
| Yakama | 0.0 /100 | #337 | Tragic $33,354 |
| Immigrants | Cuba | 0.0 /100 | #338 | Tragic $33,291 |
| Immigrants | Mexico | 0.0 /100 | #339 | Tragic $33,236 |
| Tohono O'odham | 0.0 /100 | #340 | Tragic $33,205 |
| Navajo | 0.0 /100 | #341 | Tragic $33,046 |
| Yup'ik | 0.0 /100 | #342 | Tragic $32,730 |
| Pueblo | 0.0 /100 | #343 | Tragic $32,564 |
| Lumbee | 0.0 /100 | #344 | Tragic $32,500 |
| Puerto Ricans | 0.0 /100 | #345 | Tragic $31,560 |
| Arapaho | 0.0 /100 | #346 | Tragic $31,489 |
| Houma | 0.0 /100 | #347 | Tragic $30,343 |