Osage vs Immigrants from Ethiopia Median Household Income
COMPARE
Osage
Immigrants from Ethiopia
Median Household Income
Median Household Income Comparison
Osage
Immigrants from Ethiopia
$75,240
MEDIAN HOUSEHOLD INCOME
0.2/ 100
METRIC RATING
278th/ 347
METRIC RANK
$88,687
MEDIAN HOUSEHOLD INCOME
90.9/ 100
METRIC RATING
133rd/ 347
METRIC RANK
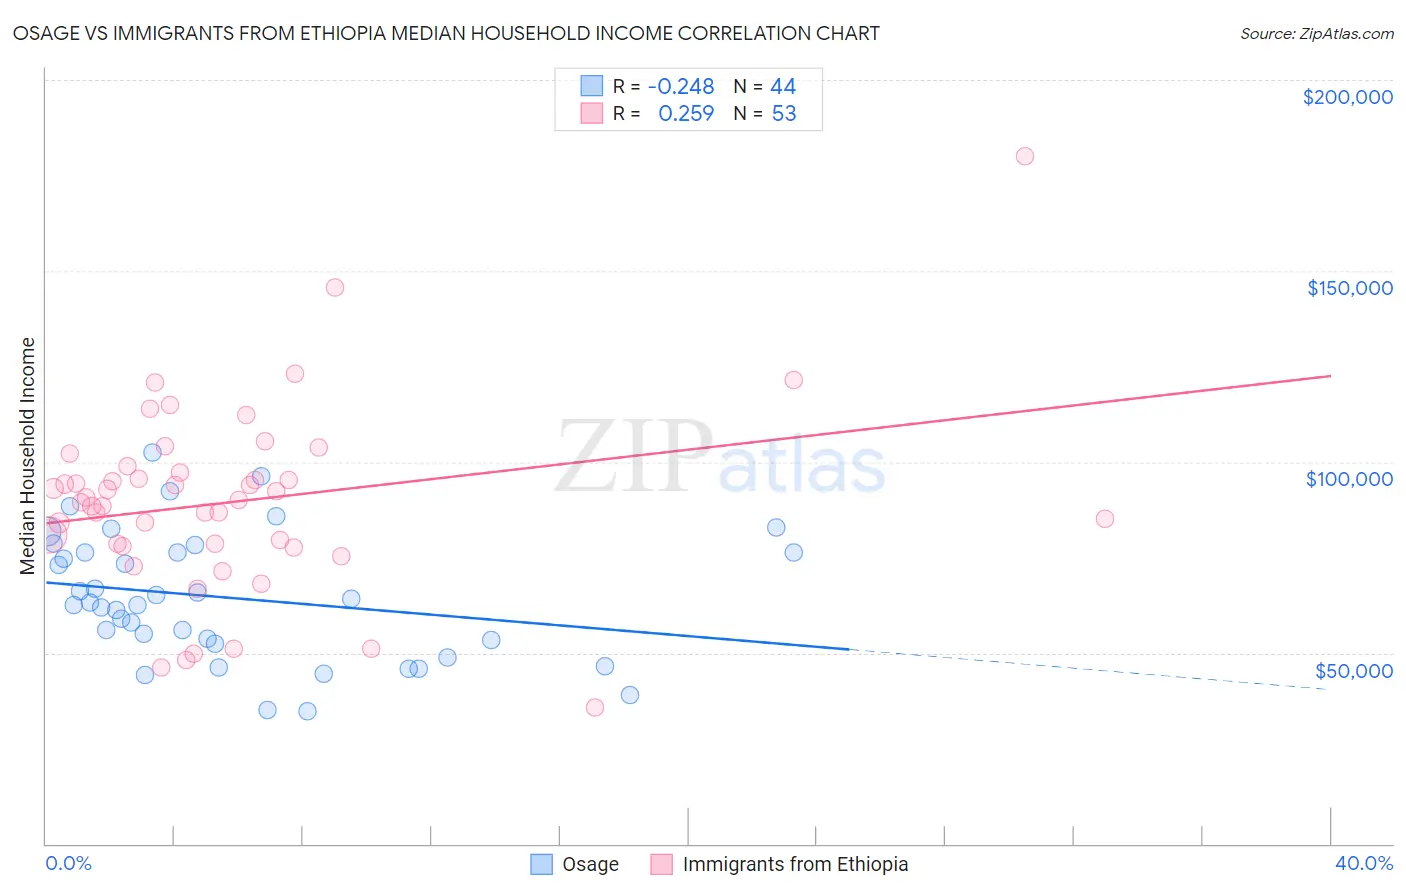
Osage vs Immigrants from Ethiopia Median Household Income Correlation Chart
The statistical analysis conducted on geographies consisting of 91,796,475 people shows a weak negative correlation between the proportion of Osage and median household income in the United States with a correlation coefficient (R) of -0.248 and weighted average of $75,240. Similarly, the statistical analysis conducted on geographies consisting of 211,436,017 people shows a weak positive correlation between the proportion of Immigrants from Ethiopia and median household income in the United States with a correlation coefficient (R) of 0.259 and weighted average of $88,687, a difference of 17.9%.
Median Household Income Correlation Summary
| Measurement | Osage | Immigrants from Ethiopia |
| Minimum | $34,735 | $35,809 |
| Maximum | $102,379 | $180,167 |
| Range | $67,644 | $144,358 |
| Mean | $64,368 | $89,607 |
| Median | $62,912 | $90,025 |
| Interquartile 25% (IQ1) | $52,984 | $78,327 |
| Interquartile 75% (IQ3) | $76,272 | $98,118 |
| Interquartile Range (IQR) | $23,288 | $19,791 |
| Standard Deviation (Sample) | $16,574 | $24,432 |
| Standard Deviation (Population) | $16,385 | $24,200 |
Similar Demographics by Median Household Income
Demographics Similar to Osage by Median Household Income
In terms of median household income, the demographic groups most similar to Osage are Immigrants from Guatemala ($75,123, a difference of 0.16%), Spanish American ($75,386, a difference of 0.19%), Immigrants from Latin America ($75,420, a difference of 0.24%), Senegalese ($74,999, a difference of 0.32%), and Immigrants from Micronesia ($75,574, a difference of 0.44%).
| Demographics | Rating | Rank | Median Household Income |
| Pennsylvania Germans | 0.3 /100 | #271 | Tragic $75,814 |
| Somalis | 0.3 /100 | #272 | Tragic $75,782 |
| Liberians | 0.2 /100 | #273 | Tragic $75,667 |
| British West Indians | 0.2 /100 | #274 | Tragic $75,647 |
| Immigrants | Micronesia | 0.2 /100 | #275 | Tragic $75,574 |
| Immigrants | Latin America | 0.2 /100 | #276 | Tragic $75,420 |
| Spanish Americans | 0.2 /100 | #277 | Tragic $75,386 |
| Osage | 0.2 /100 | #278 | Tragic $75,240 |
| Immigrants | Guatemala | 0.2 /100 | #279 | Tragic $75,123 |
| Senegalese | 0.2 /100 | #280 | Tragic $74,999 |
| Immigrants | Liberia | 0.1 /100 | #281 | Tragic $74,896 |
| Central American Indians | 0.1 /100 | #282 | Tragic $74,847 |
| Cree | 0.1 /100 | #283 | Tragic $74,685 |
| Yaqui | 0.1 /100 | #284 | Tragic $74,596 |
| Mexicans | 0.1 /100 | #285 | Tragic $74,399 |
Demographics Similar to Immigrants from Ethiopia by Median Household Income
In terms of median household income, the demographic groups most similar to Immigrants from Ethiopia are European ($88,751, a difference of 0.070%), Immigrants from Syria ($88,792, a difference of 0.12%), Swedish ($88,524, a difference of 0.18%), Immigrants from Sierra Leone ($88,498, a difference of 0.21%), and Polish ($88,472, a difference of 0.24%).
| Demographics | Rating | Rank | Median Household Income |
| Immigrants | Oceania | 92.9 /100 | #126 | Exceptional $89,100 |
| Immigrants | Peru | 92.5 /100 | #127 | Exceptional $89,010 |
| Portuguese | 92.3 /100 | #128 | Exceptional $88,976 |
| Brazilians | 92.1 /100 | #129 | Exceptional $88,934 |
| British | 92.0 /100 | #130 | Exceptional $88,914 |
| Immigrants | Syria | 91.4 /100 | #131 | Exceptional $88,792 |
| Europeans | 91.2 /100 | #132 | Exceptional $88,751 |
| Immigrants | Ethiopia | 90.9 /100 | #133 | Exceptional $88,687 |
| Swedes | 90.0 /100 | #134 | Exceptional $88,524 |
| Immigrants | Sierra Leone | 89.9 /100 | #135 | Excellent $88,498 |
| Poles | 89.7 /100 | #136 | Excellent $88,472 |
| Sierra Leoneans | 89.6 /100 | #137 | Excellent $88,463 |
| Arabs | 89.2 /100 | #138 | Excellent $88,398 |
| Immigrants | Chile | 89.2 /100 | #139 | Excellent $88,388 |
| Lebanese | 87.2 /100 | #140 | Excellent $88,091 |