Immigrants from Italy vs Ghanaian Householder Income Under 25 years
COMPARE
Immigrants from Italy
Ghanaian
Householder Income Under 25 years
Householder Income Under 25 years Comparison
Immigrants from Italy
Ghanaians
$54,449
HOUSEHOLDER INCOME UNDER 25 YEARS
99.6/ 100
METRIC RATING
79th/ 347
METRIC RANK
$52,594
HOUSEHOLDER INCOME UNDER 25 YEARS
72.9/ 100
METRIC RATING
157th/ 347
METRIC RANK
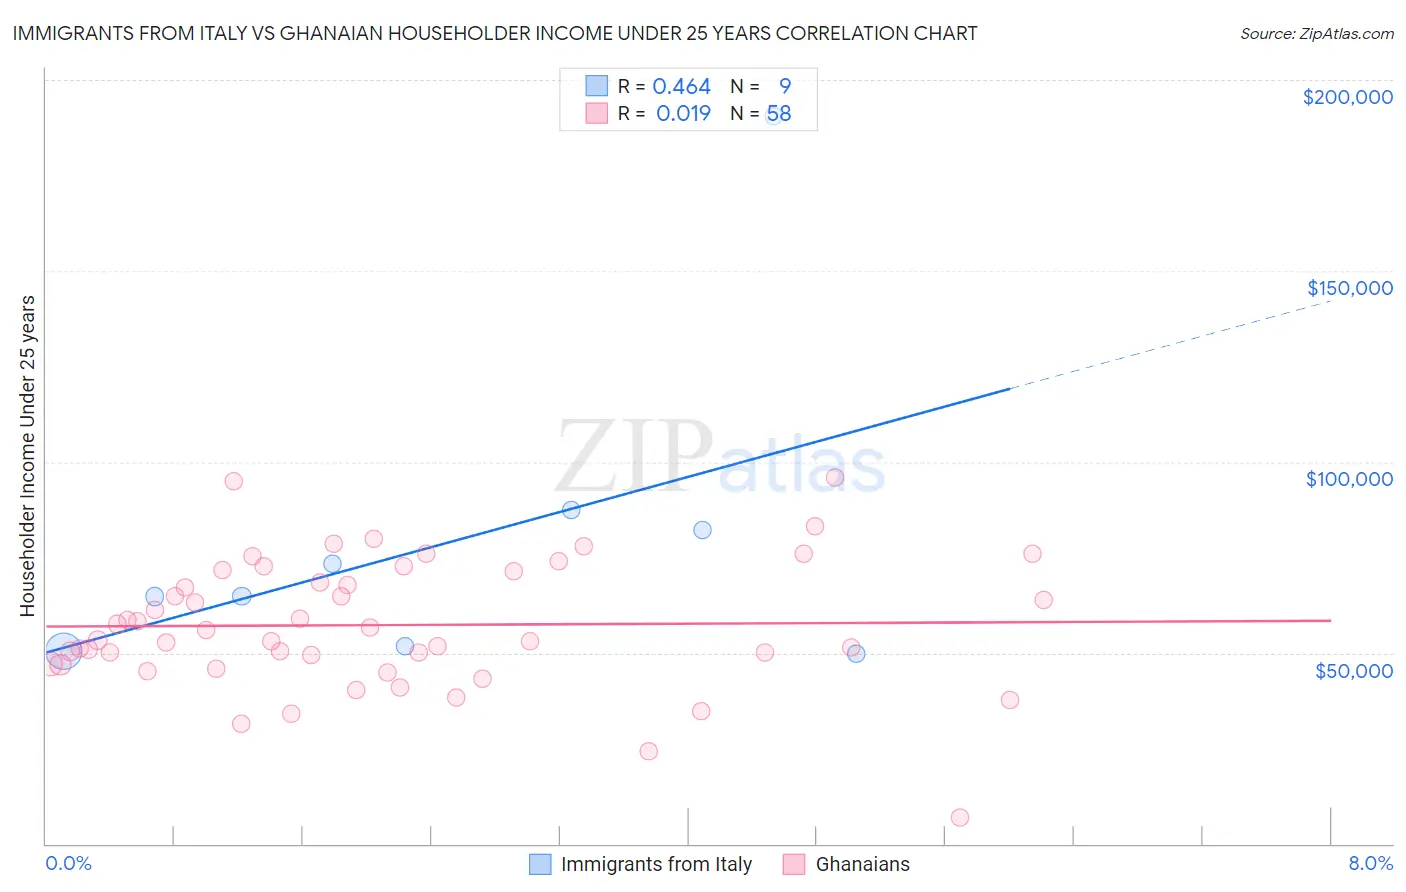
Immigrants from Italy vs Ghanaian Householder Income Under 25 years Correlation Chart
The statistical analysis conducted on geographies consisting of 270,047,838 people shows a moderate positive correlation between the proportion of Immigrants from Italy and household income with householder under the age of 25 in the United States with a correlation coefficient (R) of 0.464 and weighted average of $54,449. Similarly, the statistical analysis conducted on geographies consisting of 172,179,779 people shows no correlation between the proportion of Ghanaians and household income with householder under the age of 25 in the United States with a correlation coefficient (R) of 0.019 and weighted average of $52,594, a difference of 3.5%.
Householder Income Under 25 years Correlation Summary
| Measurement | Immigrants from Italy | Ghanaian |
| Minimum | $49,766 | $6,940 |
| Maximum | $190,500 | $96,053 |
| Range | $140,734 | $89,113 |
| Mean | $79,409 | $57,281 |
| Median | $64,734 | $54,641 |
| Interquartile 25% (IQ1) | $51,078 | $46,996 |
| Interquartile 75% (IQ3) | $84,764 | $71,280 |
| Interquartile Range (IQR) | $33,686 | $24,284 |
| Standard Deviation (Sample) | $43,825 | $16,793 |
| Standard Deviation (Population) | $41,318 | $16,648 |
Similar Demographics by Householder Income Under 25 years
Demographics Similar to Immigrants from Italy by Householder Income Under 25 years
In terms of householder income under 25 years, the demographic groups most similar to Immigrants from Italy are Egyptian ($54,444, a difference of 0.010%), Portuguese ($54,436, a difference of 0.020%), Nepalese ($54,472, a difference of 0.040%), Immigrants from Southern Europe ($54,484, a difference of 0.060%), and Immigrants from Brazil ($54,487, a difference of 0.070%).
| Demographics | Rating | Rank | Householder Income Under 25 years |
| Immigrants | Northern Europe | 99.7 /100 | #72 | Exceptional $54,571 |
| Macedonians | 99.7 /100 | #73 | Exceptional $54,563 |
| Immigrants | Grenada | 99.7 /100 | #74 | Exceptional $54,538 |
| Immigrants | Sri Lanka | 99.7 /100 | #75 | Exceptional $54,512 |
| Immigrants | Brazil | 99.6 /100 | #76 | Exceptional $54,487 |
| Immigrants | Southern Europe | 99.6 /100 | #77 | Exceptional $54,484 |
| Nepalese | 99.6 /100 | #78 | Exceptional $54,472 |
| Immigrants | Italy | 99.6 /100 | #79 | Exceptional $54,449 |
| Egyptians | 99.6 /100 | #80 | Exceptional $54,444 |
| Portuguese | 99.6 /100 | #81 | Exceptional $54,436 |
| Russians | 99.5 /100 | #82 | Exceptional $54,389 |
| Laotians | 99.5 /100 | #83 | Exceptional $54,369 |
| Bulgarians | 99.5 /100 | #84 | Exceptional $54,352 |
| Immigrants | Czechoslovakia | 99.5 /100 | #85 | Exceptional $54,352 |
| Immigrants | Croatia | 99.5 /100 | #86 | Exceptional $54,343 |
Demographics Similar to Ghanaians by Householder Income Under 25 years
In terms of householder income under 25 years, the demographic groups most similar to Ghanaians are Immigrants from Netherlands ($52,592, a difference of 0.0%), Immigrants from Nepal ($52,611, a difference of 0.030%), Immigrants from Denmark ($52,612, a difference of 0.040%), Immigrants from the Azores ($52,621, a difference of 0.050%), and Central American ($52,626, a difference of 0.060%).
| Demographics | Rating | Rank | Householder Income Under 25 years |
| Immigrants | Costa Rica | 75.2 /100 | #150 | Good $52,643 |
| Immigrants | Scotland | 75.0 /100 | #151 | Good $52,638 |
| Trinidadians and Tobagonians | 74.6 /100 | #152 | Good $52,631 |
| Central Americans | 74.4 /100 | #153 | Good $52,626 |
| Immigrants | Azores | 74.2 /100 | #154 | Good $52,621 |
| Immigrants | Denmark | 73.8 /100 | #155 | Good $52,612 |
| Immigrants | Nepal | 73.7 /100 | #156 | Good $52,611 |
| Ghanaians | 72.9 /100 | #157 | Good $52,594 |
| Immigrants | Netherlands | 72.8 /100 | #158 | Good $52,592 |
| Mongolians | 70.2 /100 | #159 | Good $52,540 |
| Immigrants | Turkey | 68.3 /100 | #160 | Good $52,503 |
| Uruguayans | 66.2 /100 | #161 | Good $52,465 |
| Immigrants | Cambodia | 65.4 /100 | #162 | Good $52,450 |
| Immigrants | Chile | 64.8 /100 | #163 | Good $52,440 |
| Immigrants | Trinidad and Tobago | 64.7 /100 | #164 | Good $52,437 |