Ugandan vs Croatian Householder Income Under 25 years
COMPARE
Ugandan
Croatian
Householder Income Under 25 years
Householder Income Under 25 years Comparison
Ugandans
Croatians
$50,923
HOUSEHOLDER INCOME UNDER 25 YEARS
4.3/ 100
METRIC RATING
231st/ 347
METRIC RANK
$51,662
HOUSEHOLDER INCOME UNDER 25 YEARS
21.6/ 100
METRIC RATING
189th/ 347
METRIC RANK
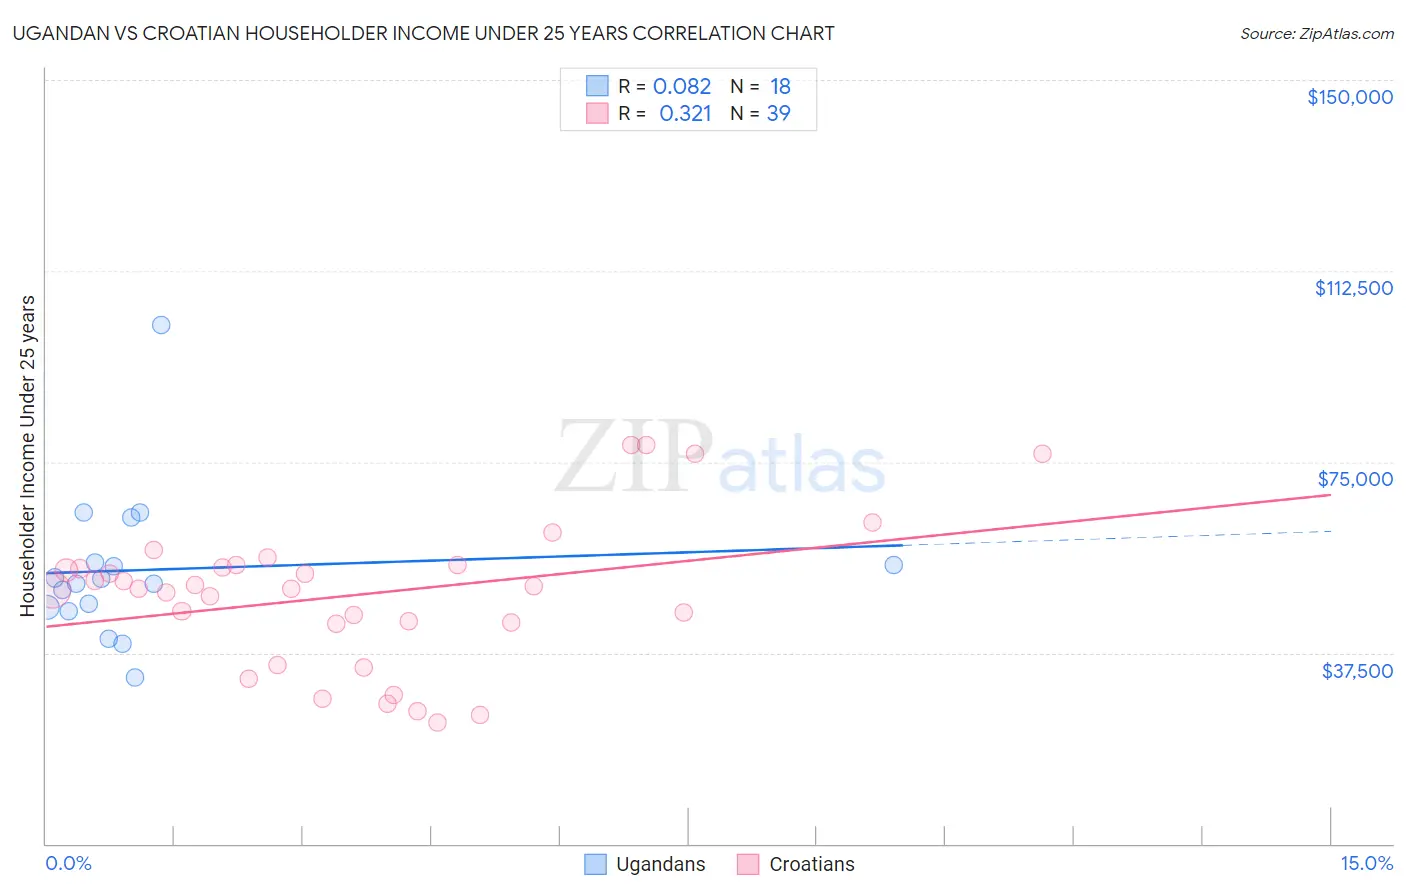
Ugandan vs Croatian Householder Income Under 25 years Correlation Chart
The statistical analysis conducted on geographies consisting of 89,521,491 people shows a slight positive correlation between the proportion of Ugandans and household income with householder under the age of 25 in the United States with a correlation coefficient (R) of 0.082 and weighted average of $50,923. Similarly, the statistical analysis conducted on geographies consisting of 315,055,397 people shows a mild positive correlation between the proportion of Croatians and household income with householder under the age of 25 in the United States with a correlation coefficient (R) of 0.321 and weighted average of $51,662, a difference of 1.5%.
Householder Income Under 25 years Correlation Summary
| Measurement | Ugandan | Croatian |
| Minimum | $32,682 | $23,750 |
| Maximum | $101,868 | $78,352 |
| Range | $69,186 | $54,602 |
| Mean | $53,778 | $48,905 |
| Median | $51,561 | $50,153 |
| Interquartile 25% (IQ1) | $46,457 | $43,159 |
| Interquartile 75% (IQ3) | $55,330 | $54,688 |
| Interquartile Range (IQR) | $8,874 | $11,529 |
| Standard Deviation (Sample) | $14,802 | $14,236 |
| Standard Deviation (Population) | $14,385 | $14,052 |
Similar Demographics by Householder Income Under 25 years
Demographics Similar to Ugandans by Householder Income Under 25 years
In terms of householder income under 25 years, the demographic groups most similar to Ugandans are Jamaican ($50,929, a difference of 0.010%), Yuman ($50,933, a difference of 0.020%), Slovene ($50,886, a difference of 0.070%), Immigrants from Norway ($50,984, a difference of 0.12%), and Pennsylvania German ($50,852, a difference of 0.14%).
| Demographics | Rating | Rank | Householder Income Under 25 years |
| Belizeans | 6.4 /100 | #224 | Tragic $51,094 |
| Immigrants | Jamaica | 5.6 /100 | #225 | Tragic $51,038 |
| Yugoslavians | 5.5 /100 | #226 | Tragic $51,028 |
| Immigrants | Central America | 5.4 /100 | #227 | Tragic $51,022 |
| Immigrants | Norway | 5.0 /100 | #228 | Tragic $50,984 |
| Yuman | 4.4 /100 | #229 | Tragic $50,933 |
| Jamaicans | 4.4 /100 | #230 | Tragic $50,929 |
| Ugandans | 4.3 /100 | #231 | Tragic $50,923 |
| Slovenes | 4.0 /100 | #232 | Tragic $50,886 |
| Pennsylvania Germans | 3.7 /100 | #233 | Tragic $50,852 |
| Kenyans | 3.3 /100 | #234 | Tragic $50,815 |
| Spanish | 3.3 /100 | #235 | Tragic $50,813 |
| English | 3.3 /100 | #236 | Tragic $50,805 |
| Germans | 3.3 /100 | #237 | Tragic $50,804 |
| Iraqis | 3.2 /100 | #238 | Tragic $50,802 |
Demographics Similar to Croatians by Householder Income Under 25 years
In terms of householder income under 25 years, the demographic groups most similar to Croatians are Northern European ($51,678, a difference of 0.030%), Immigrants from South Africa ($51,705, a difference of 0.080%), Malaysian ($51,615, a difference of 0.090%), Alaskan Athabascan ($51,713, a difference of 0.10%), and Panamanian ($51,611, a difference of 0.10%).
| Demographics | Rating | Rank | Householder Income Under 25 years |
| Jordanians | 27.6 /100 | #182 | Fair $51,796 |
| Mexican American Indians | 27.0 /100 | #183 | Fair $51,783 |
| Paiute | 25.1 /100 | #184 | Fair $51,743 |
| Immigrants | Latvia | 24.8 /100 | #185 | Fair $51,737 |
| Alaskan Athabascans | 23.8 /100 | #186 | Fair $51,713 |
| Immigrants | South Africa | 23.4 /100 | #187 | Fair $51,705 |
| Northern Europeans | 22.2 /100 | #188 | Fair $51,678 |
| Croatians | 21.6 /100 | #189 | Fair $51,662 |
| Malaysians | 19.7 /100 | #190 | Poor $51,615 |
| Panamanians | 19.5 /100 | #191 | Poor $51,611 |
| West Indians | 18.5 /100 | #192 | Poor $51,583 |
| Immigrants | Eritrea | 18.1 /100 | #193 | Poor $51,574 |
| Guatemalans | 16.4 /100 | #194 | Poor $51,525 |
| Estonians | 16.4 /100 | #195 | Poor $51,523 |
| Palestinians | 16.1 /100 | #196 | Poor $51,515 |