Immigrants from Zimbabwe vs Ghanaian Householder Income Under 25 years
COMPARE
Immigrants from Zimbabwe
Ghanaian
Householder Income Under 25 years
Householder Income Under 25 years Comparison
Immigrants from Zimbabwe
Ghanaians
$51,914
HOUSEHOLDER INCOME UNDER 25 YEARS
33.8/ 100
METRIC RATING
175th/ 347
METRIC RANK
$52,594
HOUSEHOLDER INCOME UNDER 25 YEARS
72.9/ 100
METRIC RATING
157th/ 347
METRIC RANK
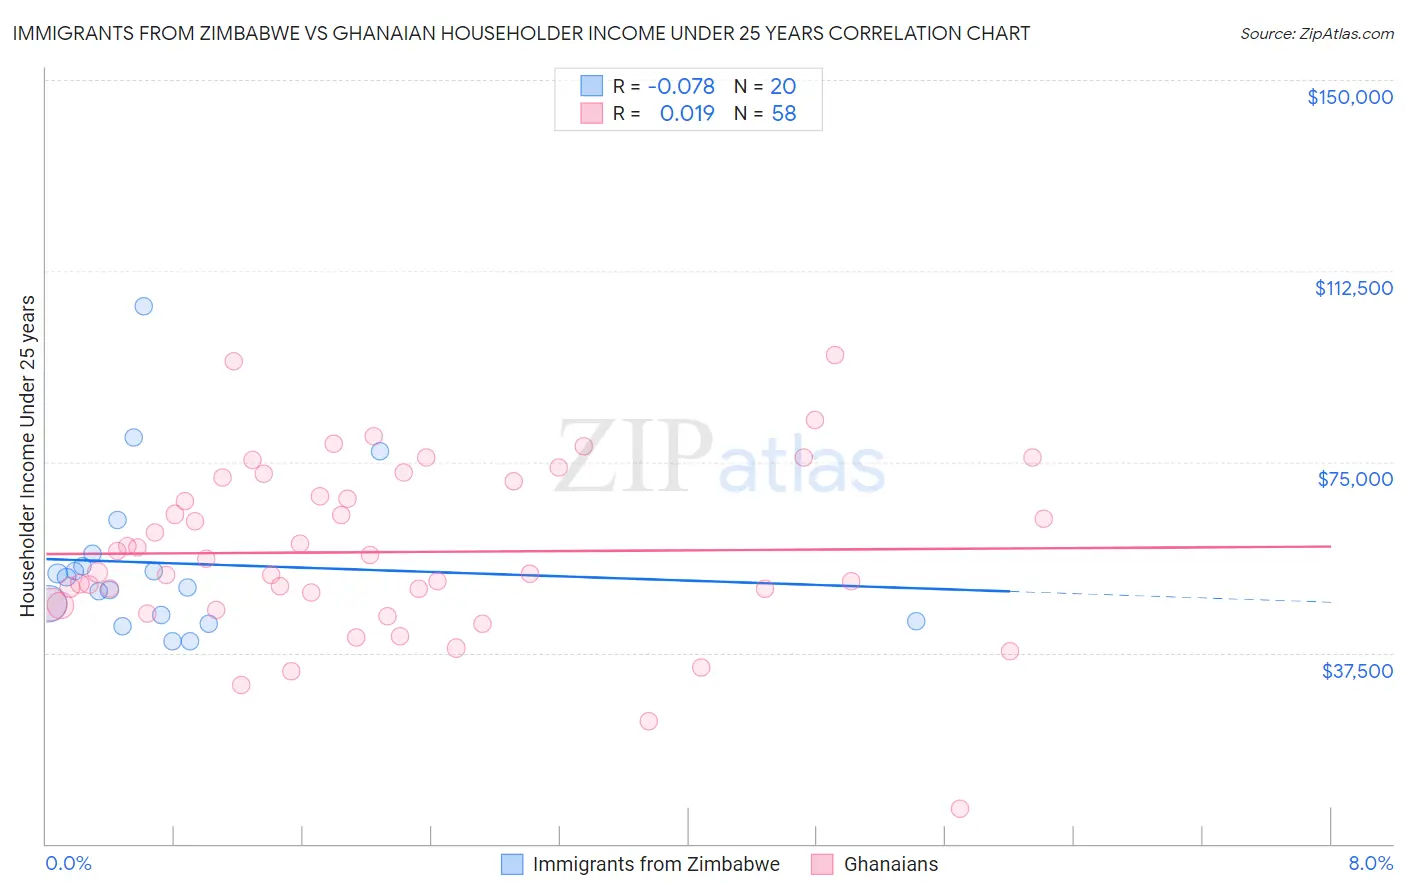
Immigrants from Zimbabwe vs Ghanaian Householder Income Under 25 years Correlation Chart
The statistical analysis conducted on geographies consisting of 110,683,566 people shows a slight negative correlation between the proportion of Immigrants from Zimbabwe and household income with householder under the age of 25 in the United States with a correlation coefficient (R) of -0.078 and weighted average of $51,914. Similarly, the statistical analysis conducted on geographies consisting of 172,179,779 people shows no correlation between the proportion of Ghanaians and household income with householder under the age of 25 in the United States with a correlation coefficient (R) of 0.019 and weighted average of $52,594, a difference of 1.3%.
Householder Income Under 25 years Correlation Summary
| Measurement | Immigrants from Zimbabwe | Ghanaian |
| Minimum | $39,852 | $6,940 |
| Maximum | $105,520 | $96,053 |
| Range | $65,668 | $89,113 |
| Mean | $55,059 | $57,281 |
| Median | $51,281 | $54,641 |
| Interquartile 25% (IQ1) | $44,321 | $46,996 |
| Interquartile 75% (IQ3) | $55,822 | $71,280 |
| Interquartile Range (IQR) | $11,501 | $24,284 |
| Standard Deviation (Sample) | $16,003 | $16,793 |
| Standard Deviation (Population) | $15,598 | $16,648 |
Demographics Similar to Immigrants from Zimbabwe and Ghanaians by Householder Income Under 25 years
In terms of householder income under 25 years, the demographic groups most similar to Immigrants from Zimbabwe are Austrian ($51,898, a difference of 0.030%), Immigrants from Western Asia ($52,190, a difference of 0.53%), Barbadian ($52,202, a difference of 0.56%), Cypriot ($52,209, a difference of 0.57%), and Immigrants from Uruguay ($52,302, a difference of 0.75%). Similarly, the demographic groups most similar to Ghanaians are Immigrants from Netherlands ($52,592, a difference of 0.0%), Immigrants from Nepal ($52,611, a difference of 0.030%), Mongolian ($52,540, a difference of 0.10%), Immigrants from Turkey ($52,503, a difference of 0.17%), and Uruguayan ($52,465, a difference of 0.25%).
| Demographics | Rating | Rank | Householder Income Under 25 years |
| Immigrants | Nepal | 73.7 /100 | #156 | Good $52,611 |
| Ghanaians | 72.9 /100 | #157 | Good $52,594 |
| Immigrants | Netherlands | 72.8 /100 | #158 | Good $52,592 |
| Mongolians | 70.2 /100 | #159 | Good $52,540 |
| Immigrants | Turkey | 68.3 /100 | #160 | Good $52,503 |
| Uruguayans | 66.2 /100 | #161 | Good $52,465 |
| Immigrants | Cambodia | 65.4 /100 | #162 | Good $52,450 |
| Immigrants | Chile | 64.8 /100 | #163 | Good $52,440 |
| Immigrants | Trinidad and Tobago | 64.7 /100 | #164 | Good $52,437 |
| Poles | 63.0 /100 | #165 | Good $52,407 |
| Immigrants | Austria | 62.6 /100 | #166 | Good $52,400 |
| Immigrants | Uganda | 61.1 /100 | #167 | Good $52,374 |
| Japanese | 60.5 /100 | #168 | Good $52,365 |
| Canadians | 58.8 /100 | #169 | Average $52,336 |
| Israelis | 58.8 /100 | #170 | Average $52,335 |
| Immigrants | Uruguay | 56.8 /100 | #171 | Average $52,302 |
| Cypriots | 51.2 /100 | #172 | Average $52,209 |
| Barbadians | 50.8 /100 | #173 | Average $52,202 |
| Immigrants | Western Asia | 50.0 /100 | #174 | Average $52,190 |
| Immigrants | Zimbabwe | 33.8 /100 | #175 | Fair $51,914 |
| Austrians | 32.9 /100 | #176 | Fair $51,898 |