Turkish vs Austrian Householder Income Ages 45 - 64 years
COMPARE
Turkish
Austrian
Householder Income Ages 45 - 64 years
Householder Income Ages 45 - 64 years Comparison
Turks
Austrians
$117,814
HOUSEHOLDER INCOME AGES 45 - 64 YEARS
100.0/ 100
METRIC RATING
28th/ 347
METRIC RANK
$108,692
HOUSEHOLDER INCOME AGES 45 - 64 YEARS
98.5/ 100
METRIC RATING
86th/ 347
METRIC RANK
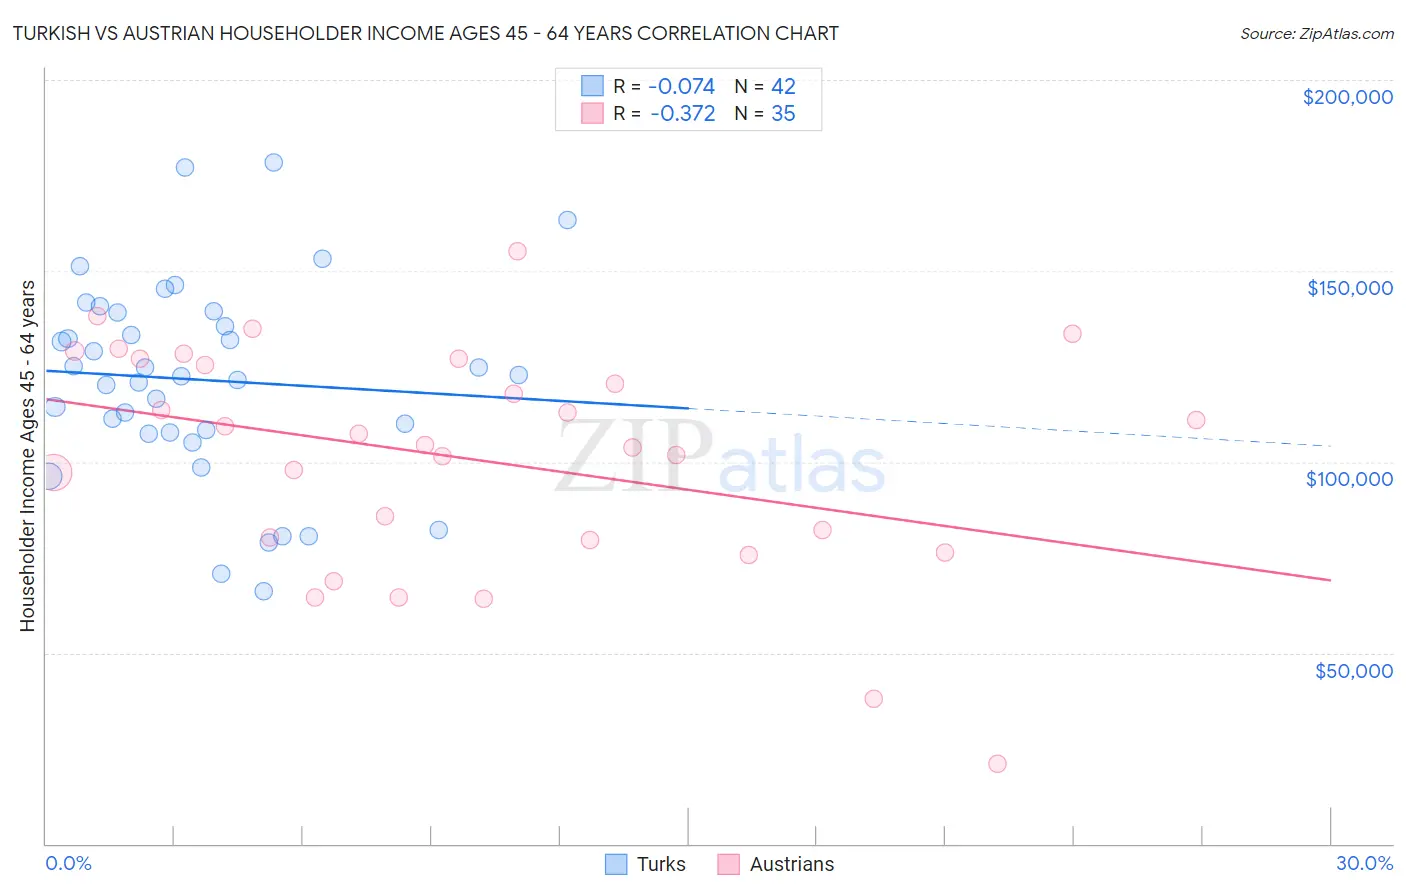
Turkish vs Austrian Householder Income Ages 45 - 64 years Correlation Chart
The statistical analysis conducted on geographies consisting of 271,498,230 people shows a slight negative correlation between the proportion of Turks and household income with householder between the ages 45 and 64 in the United States with a correlation coefficient (R) of -0.074 and weighted average of $117,814. Similarly, the statistical analysis conducted on geographies consisting of 451,173,379 people shows a mild negative correlation between the proportion of Austrians and household income with householder between the ages 45 and 64 in the United States with a correlation coefficient (R) of -0.372 and weighted average of $108,692, a difference of 8.4%.
Householder Income Ages 45 - 64 years Correlation Summary
| Measurement | Turkish | Austrian |
| Minimum | $66,250 | $20,833 |
| Maximum | $178,523 | $155,000 |
| Range | $112,273 | $134,167 |
| Mean | $121,410 | $100,755 |
| Median | $122,614 | $104,463 |
| Interquartile 25% (IQ1) | $107,799 | $79,395 |
| Interquartile 75% (IQ3) | $139,122 | $126,954 |
| Interquartile Range (IQR) | $31,324 | $47,559 |
| Standard Deviation (Sample) | $26,168 | $29,820 |
| Standard Deviation (Population) | $25,855 | $29,391 |
Similar Demographics by Householder Income Ages 45 - 64 years
Demographics Similar to Turks by Householder Income Ages 45 - 64 years
In terms of householder income ages 45 - 64 years, the demographic groups most similar to Turks are Bhutanese ($117,750, a difference of 0.050%), Immigrants from Bolivia ($117,731, a difference of 0.070%), Immigrants from Northern Europe ($117,930, a difference of 0.10%), Immigrants from Sweden ($118,318, a difference of 0.43%), and Asian ($118,426, a difference of 0.52%).
| Demographics | Rating | Rank | Householder Income Ages 45 - 64 years |
| Immigrants | Sri Lanka | 100.0 /100 | #21 | Exceptional $119,094 |
| Immigrants | Belgium | 100.0 /100 | #22 | Exceptional $118,932 |
| Bolivians | 100.0 /100 | #23 | Exceptional $118,871 |
| Immigrants | Japan | 100.0 /100 | #24 | Exceptional $118,498 |
| Asians | 100.0 /100 | #25 | Exceptional $118,426 |
| Immigrants | Sweden | 100.0 /100 | #26 | Exceptional $118,318 |
| Immigrants | Northern Europe | 100.0 /100 | #27 | Exceptional $117,930 |
| Turks | 100.0 /100 | #28 | Exceptional $117,814 |
| Bhutanese | 100.0 /100 | #29 | Exceptional $117,750 |
| Immigrants | Bolivia | 100.0 /100 | #30 | Exceptional $117,731 |
| Immigrants | Asia | 100.0 /100 | #31 | Exceptional $116,566 |
| Russians | 100.0 /100 | #32 | Exceptional $116,328 |
| Chinese | 100.0 /100 | #33 | Exceptional $116,156 |
| Immigrants | Denmark | 100.0 /100 | #34 | Exceptional $116,000 |
| Latvians | 100.0 /100 | #35 | Exceptional $115,957 |
Demographics Similar to Austrians by Householder Income Ages 45 - 64 years
In terms of householder income ages 45 - 64 years, the demographic groups most similar to Austrians are Tongan ($108,643, a difference of 0.040%), Romanian ($108,609, a difference of 0.080%), Immigrants from Afghanistan ($108,785, a difference of 0.090%), Immigrants from Western Europe ($108,824, a difference of 0.12%), and Ukrainian ($108,475, a difference of 0.20%).
| Demographics | Rating | Rank | Householder Income Ages 45 - 64 years |
| Immigrants | Bulgaria | 98.9 /100 | #79 | Exceptional $109,379 |
| Jordanians | 98.9 /100 | #80 | Exceptional $109,376 |
| Immigrants | Eastern Europe | 98.9 /100 | #81 | Exceptional $109,335 |
| Immigrants | North America | 98.8 /100 | #82 | Exceptional $109,198 |
| Immigrants | Spain | 98.8 /100 | #83 | Exceptional $109,051 |
| Immigrants | Western Europe | 98.6 /100 | #84 | Exceptional $108,824 |
| Immigrants | Afghanistan | 98.6 /100 | #85 | Exceptional $108,785 |
| Austrians | 98.5 /100 | #86 | Exceptional $108,692 |
| Tongans | 98.5 /100 | #87 | Exceptional $108,643 |
| Romanians | 98.5 /100 | #88 | Exceptional $108,609 |
| Ukrainians | 98.3 /100 | #89 | Exceptional $108,475 |
| Immigrants | Philippines | 98.3 /100 | #90 | Exceptional $108,471 |
| Immigrants | Lebanon | 98.3 /100 | #91 | Exceptional $108,471 |
| Croatians | 98.3 /100 | #92 | Exceptional $108,383 |
| Immigrants | Croatia | 98.2 /100 | #93 | Exceptional $108,304 |