Trinidadian and Tobagonian vs Immigrants from Ethiopia Householder Income Under 25 years
COMPARE
Trinidadian and Tobagonian
Immigrants from Ethiopia
Householder Income Under 25 years
Householder Income Under 25 years Comparison
Trinidadians and Tobagonians
Immigrants from Ethiopia
$52,631
HOUSEHOLDER INCOME UNDER 25 YEARS
74.6/ 100
METRIC RATING
152nd/ 347
METRIC RANK
$53,408
HOUSEHOLDER INCOME UNDER 25 YEARS
95.2/ 100
METRIC RATING
122nd/ 347
METRIC RANK
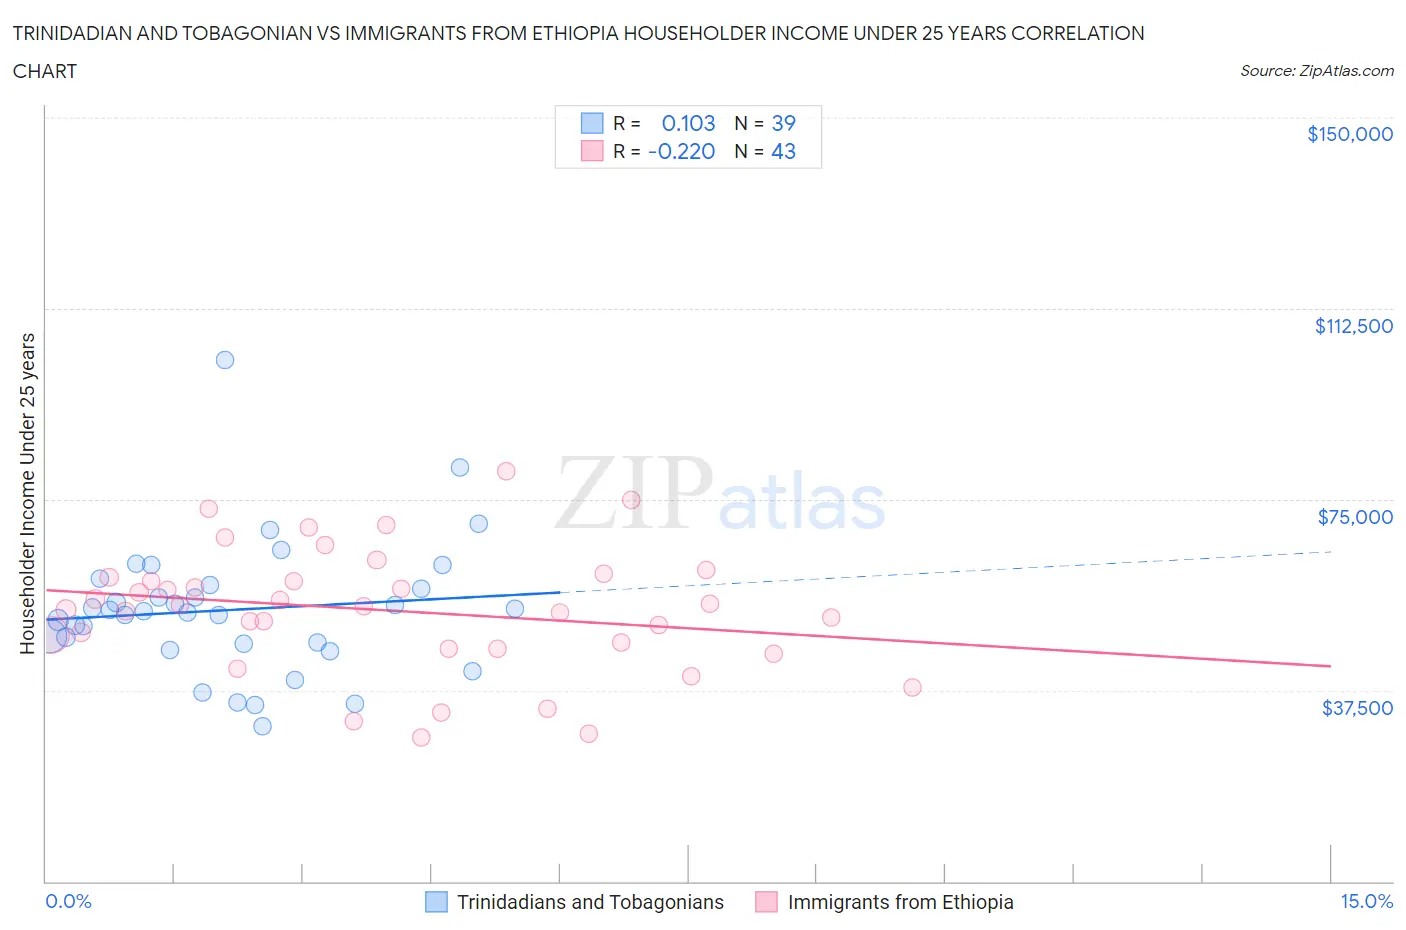
Trinidadian and Tobagonian vs Immigrants from Ethiopia Householder Income Under 25 years Correlation Chart
The statistical analysis conducted on geographies consisting of 193,000,930 people shows a poor positive correlation between the proportion of Trinidadians and Tobagonians and household income with householder under the age of 25 in the United States with a correlation coefficient (R) of 0.103 and weighted average of $52,631. Similarly, the statistical analysis conducted on geographies consisting of 192,182,425 people shows a weak negative correlation between the proportion of Immigrants from Ethiopia and household income with householder under the age of 25 in the United States with a correlation coefficient (R) of -0.220 and weighted average of $53,408, a difference of 1.5%.
Householder Income Under 25 years Correlation Summary
| Measurement | Trinidadian and Tobagonian | Immigrants from Ethiopia |
| Minimum | $30,455 | $28,125 |
| Maximum | $102,312 | $80,609 |
| Range | $71,857 | $52,484 |
| Mean | $53,317 | $53,146 |
| Median | $52,934 | $53,961 |
| Interquartile 25% (IQ1) | $46,536 | $45,759 |
| Interquartile 75% (IQ3) | $58,164 | $59,608 |
| Interquartile Range (IQR) | $11,628 | $13,849 |
| Standard Deviation (Sample) | $13,212 | $12,167 |
| Standard Deviation (Population) | $13,042 | $12,025 |
Similar Demographics by Householder Income Under 25 years
Demographics Similar to Trinidadians and Tobagonians by Householder Income Under 25 years
In terms of householder income under 25 years, the demographic groups most similar to Trinidadians and Tobagonians are Immigrants from Scotland ($52,638, a difference of 0.010%), Central American ($52,626, a difference of 0.010%), Immigrants from Costa Rica ($52,643, a difference of 0.020%), Immigrants from the Azores ($52,621, a difference of 0.020%), and Scandinavian ($52,654, a difference of 0.040%).
| Demographics | Rating | Rank | Householder Income Under 25 years |
| Immigrants | Western Europe | 86.7 /100 | #145 | Excellent $52,957 |
| Immigrants | Hungary | 81.6 /100 | #146 | Excellent $52,798 |
| Latvians | 81.0 /100 | #147 | Excellent $52,783 |
| French Canadians | 76.5 /100 | #148 | Good $52,672 |
| Scandinavians | 75.7 /100 | #149 | Good $52,654 |
| Immigrants | Costa Rica | 75.2 /100 | #150 | Good $52,643 |
| Immigrants | Scotland | 75.0 /100 | #151 | Good $52,638 |
| Trinidadians and Tobagonians | 74.6 /100 | #152 | Good $52,631 |
| Central Americans | 74.4 /100 | #153 | Good $52,626 |
| Immigrants | Azores | 74.2 /100 | #154 | Good $52,621 |
| Immigrants | Denmark | 73.8 /100 | #155 | Good $52,612 |
| Immigrants | Nepal | 73.7 /100 | #156 | Good $52,611 |
| Ghanaians | 72.9 /100 | #157 | Good $52,594 |
| Immigrants | Netherlands | 72.8 /100 | #158 | Good $52,592 |
| Mongolians | 70.2 /100 | #159 | Good $52,540 |
Demographics Similar to Immigrants from Ethiopia by Householder Income Under 25 years
In terms of householder income under 25 years, the demographic groups most similar to Immigrants from Ethiopia are Immigrants from Canada ($53,411, a difference of 0.010%), Italian ($53,426, a difference of 0.030%), Guamanian/Chamorro ($53,423, a difference of 0.030%), Immigrants from Iraq ($53,384, a difference of 0.040%), and Colombian ($53,357, a difference of 0.10%).
| Demographics | Rating | Rank | Householder Income Under 25 years |
| Immigrants | Albania | 96.9 /100 | #115 | Exceptional $53,597 |
| Immigrants | Spain | 96.6 /100 | #116 | Exceptional $53,560 |
| Lithuanians | 96.6 /100 | #117 | Exceptional $53,552 |
| Immigrants | Switzerland | 96.3 /100 | #118 | Exceptional $53,528 |
| Italians | 95.4 /100 | #119 | Exceptional $53,426 |
| Guamanians/Chamorros | 95.3 /100 | #120 | Exceptional $53,423 |
| Immigrants | Canada | 95.2 /100 | #121 | Exceptional $53,411 |
| Immigrants | Ethiopia | 95.2 /100 | #122 | Exceptional $53,408 |
| Immigrants | Iraq | 94.9 /100 | #123 | Exceptional $53,384 |
| Colombians | 94.6 /100 | #124 | Exceptional $53,357 |
| Pakistanis | 94.1 /100 | #125 | Exceptional $53,325 |
| Immigrants | Serbia | 94.1 /100 | #126 | Exceptional $53,321 |
| Immigrants | North America | 93.9 /100 | #127 | Exceptional $53,307 |
| Immigrants | Bulgaria | 93.9 /100 | #128 | Exceptional $53,305 |
| New Zealanders | 93.7 /100 | #129 | Exceptional $53,294 |