Immigrants from England vs Alsatian Per Capita Income
COMPARE
Immigrants from England
Alsatian
Per Capita Income
Per Capita Income Comparison
Immigrants from England
Alsatians
$48,844
PER CAPITA INCOME
99.7/ 100
METRIC RATING
76th/ 347
METRIC RANK
$47,284
PER CAPITA INCOME
98.3/ 100
METRIC RATING
96th/ 347
METRIC RANK
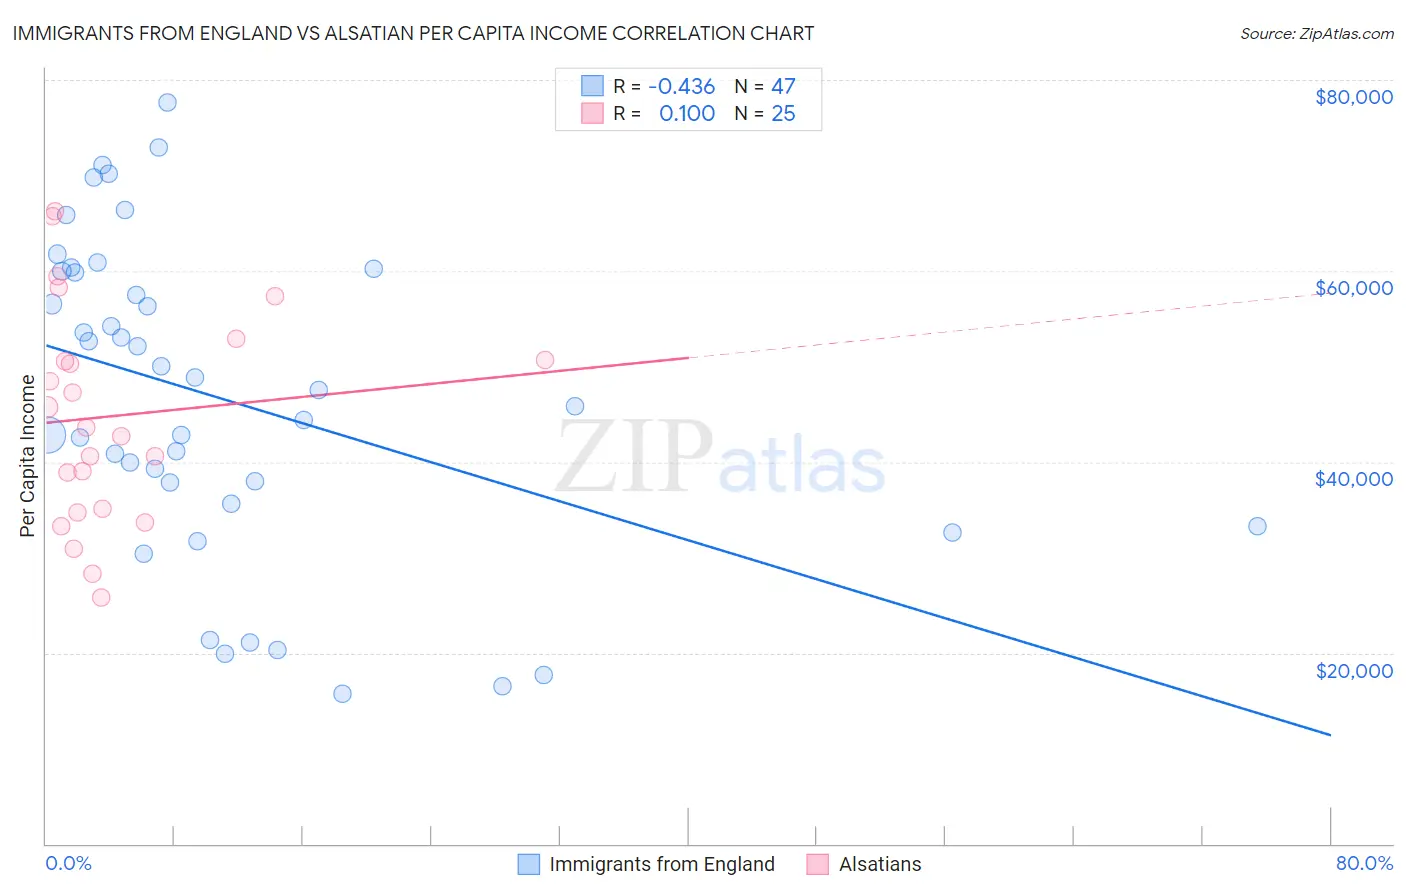
Immigrants from England vs Alsatian Per Capita Income Correlation Chart
The statistical analysis conducted on geographies consisting of 391,908,238 people shows a moderate negative correlation between the proportion of Immigrants from England and per capita income in the United States with a correlation coefficient (R) of -0.436 and weighted average of $48,844. Similarly, the statistical analysis conducted on geographies consisting of 82,682,365 people shows a slight positive correlation between the proportion of Alsatians and per capita income in the United States with a correlation coefficient (R) of 0.100 and weighted average of $47,284, a difference of 3.3%.
Per Capita Income Correlation Summary
| Measurement | Immigrants from England | Alsatian |
| Minimum | $15,716 | $25,853 |
| Maximum | $77,696 | $66,221 |
| Range | $61,980 | $40,368 |
| Mean | $46,607 | $44,810 |
| Median | $47,511 | $43,610 |
| Interquartile 25% (IQ1) | $35,676 | $34,894 |
| Interquartile 75% (IQ3) | $59,917 | $51,799 |
| Interquartile Range (IQR) | $24,241 | $16,905 |
| Standard Deviation (Sample) | $16,522 | $11,224 |
| Standard Deviation (Population) | $16,346 | $10,998 |
Demographics Similar to Immigrants from England and Alsatians by Per Capita Income
In terms of per capita income, the demographic groups most similar to Immigrants from England are Immigrants from Kazakhstan ($48,747, a difference of 0.20%), Immigrants from Italy ($48,654, a difference of 0.39%), Romanian ($48,445, a difference of 0.82%), Egyptian ($48,358, a difference of 1.0%), and Armenian ($48,287, a difference of 1.1%). Similarly, the demographic groups most similar to Alsatians are Immigrants from Egypt ($47,361, a difference of 0.16%), Albanian ($47,379, a difference of 0.20%), Immigrants from Zimbabwe ($47,394, a difference of 0.23%), Immigrants from Moldova ($47,489, a difference of 0.43%), and Italian ($47,574, a difference of 0.61%).
| Demographics | Rating | Rank | Per Capita Income |
| Immigrants | England | 99.7 /100 | #76 | Exceptional $48,844 |
| Immigrants | Kazakhstan | 99.7 /100 | #77 | Exceptional $48,747 |
| Immigrants | Italy | 99.6 /100 | #78 | Exceptional $48,654 |
| Romanians | 99.5 /100 | #79 | Exceptional $48,445 |
| Egyptians | 99.5 /100 | #80 | Exceptional $48,358 |
| Armenians | 99.4 /100 | #81 | Exceptional $48,287 |
| Immigrants | Indonesia | 99.4 /100 | #82 | Exceptional $48,195 |
| Immigrants | Brazil | 99.4 /100 | #83 | Exceptional $48,164 |
| Immigrants | Ukraine | 99.3 /100 | #84 | Exceptional $48,134 |
| Austrians | 99.3 /100 | #85 | Exceptional $48,116 |
| Immigrants | Southern Europe | 99.3 /100 | #86 | Exceptional $48,027 |
| Ukrainians | 99.3 /100 | #87 | Exceptional $48,014 |
| Croatians | 99.0 /100 | #88 | Exceptional $47,742 |
| Northern Europeans | 98.9 /100 | #89 | Exceptional $47,698 |
| Italians | 98.8 /100 | #90 | Exceptional $47,574 |
| Macedonians | 98.8 /100 | #91 | Exceptional $47,573 |
| Immigrants | Moldova | 98.7 /100 | #92 | Exceptional $47,489 |
| Immigrants | Zimbabwe | 98.5 /100 | #93 | Exceptional $47,394 |
| Albanians | 98.5 /100 | #94 | Exceptional $47,379 |
| Immigrants | Egypt | 98.5 /100 | #95 | Exceptional $47,361 |
| Alsatians | 98.3 /100 | #96 | Exceptional $47,284 |