Tongan vs Immigrants from Eastern Asia Median Earnings
COMPARE
Tongan
Immigrants from Eastern Asia
Median Earnings
Median Earnings Comparison
Tongans
Immigrants from Eastern Asia
$45,665
MEDIAN EARNINGS
25.4/ 100
METRIC RATING
205th/ 347
METRIC RANK
$56,183
MEDIAN EARNINGS
100.0/ 100
METRIC RATING
16th/ 347
METRIC RANK
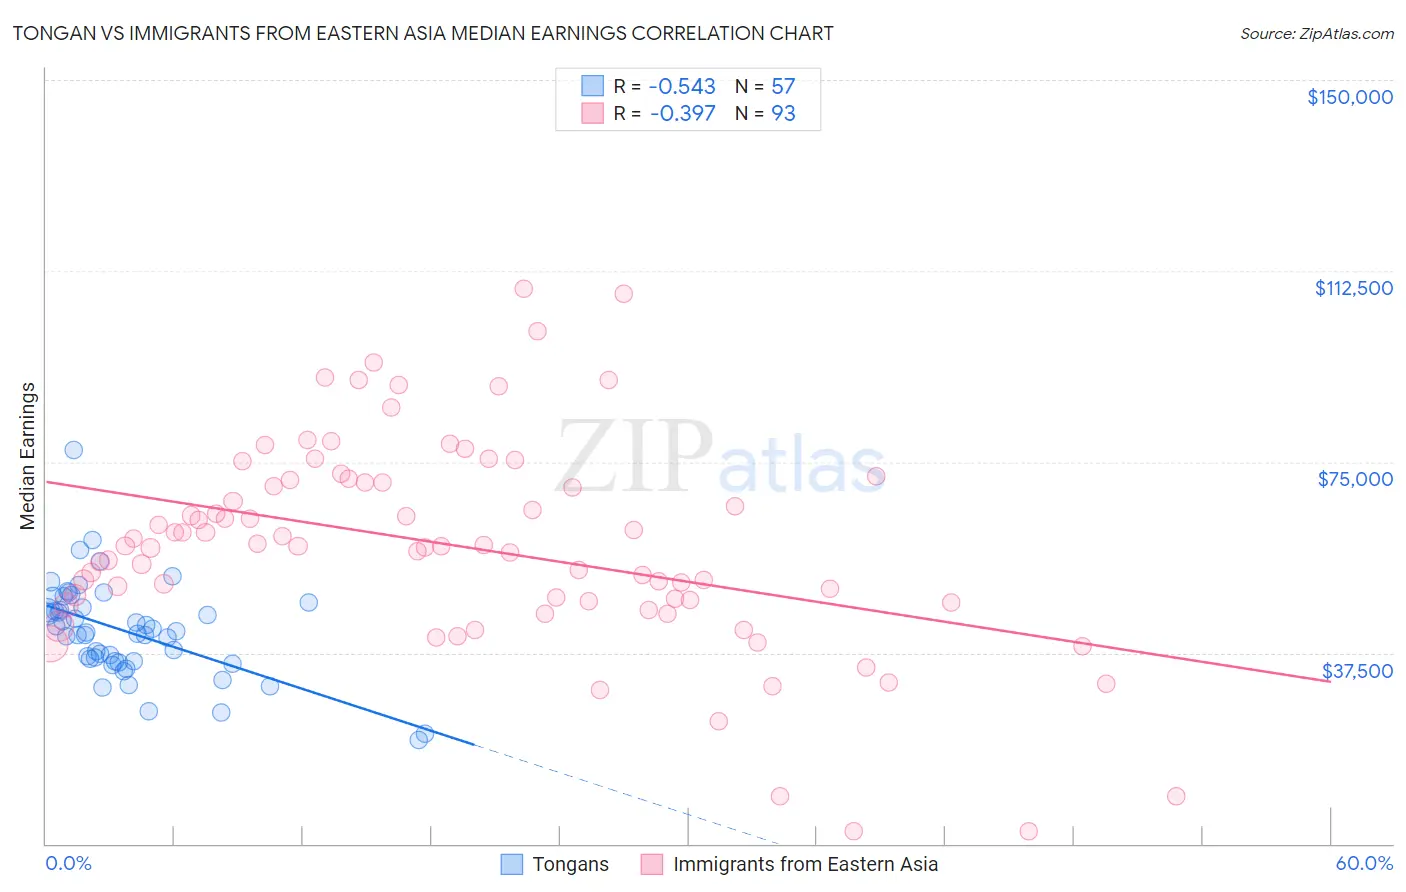
Tongan vs Immigrants from Eastern Asia Median Earnings Correlation Chart
The statistical analysis conducted on geographies consisting of 102,906,626 people shows a substantial negative correlation between the proportion of Tongans and median earnings in the United States with a correlation coefficient (R) of -0.543 and weighted average of $45,665. Similarly, the statistical analysis conducted on geographies consisting of 499,910,866 people shows a mild negative correlation between the proportion of Immigrants from Eastern Asia and median earnings in the United States with a correlation coefficient (R) of -0.397 and weighted average of $56,183, a difference of 23.0%.
Median Earnings Correlation Summary
| Measurement | Tongan | Immigrants from Eastern Asia |
| Minimum | $20,292 | $2,499 |
| Maximum | $77,441 | $109,069 |
| Range | $57,149 | $106,570 |
| Mean | $41,730 | $58,494 |
| Median | $41,421 | $58,436 |
| Interquartile 25% (IQ1) | $35,786 | $47,510 |
| Interquartile 75% (IQ3) | $46,789 | $71,190 |
| Interquartile Range (IQR) | $11,003 | $23,680 |
| Standard Deviation (Sample) | $9,523 | $20,635 |
| Standard Deviation (Population) | $9,439 | $20,524 |
Similar Demographics by Median Earnings
Demographics Similar to Tongans by Median Earnings
In terms of median earnings, the demographic groups most similar to Tongans are Immigrants from Uruguay ($45,682, a difference of 0.040%), Immigrants from Ghana ($45,641, a difference of 0.050%), Welsh ($45,710, a difference of 0.10%), Immigrants from Senegal ($45,611, a difference of 0.12%), and Immigrants from Trinidad and Tobago ($45,729, a difference of 0.14%).
| Demographics | Rating | Rank | Median Earnings |
| Trinidadians and Tobagonians | 29.7 /100 | #198 | Fair $45,820 |
| Immigrants | Barbados | 29.6 /100 | #199 | Fair $45,816 |
| Immigrants | Azores | 29.5 /100 | #200 | Fair $45,812 |
| Celtics | 27.2 /100 | #201 | Fair $45,732 |
| Immigrants | Trinidad and Tobago | 27.1 /100 | #202 | Fair $45,729 |
| Welsh | 26.6 /100 | #203 | Fair $45,710 |
| Immigrants | Uruguay | 25.9 /100 | #204 | Fair $45,682 |
| Tongans | 25.4 /100 | #205 | Fair $45,665 |
| Immigrants | Ghana | 24.8 /100 | #206 | Fair $45,641 |
| Immigrants | Senegal | 24.0 /100 | #207 | Fair $45,611 |
| Immigrants | Bosnia and Herzegovina | 23.7 /100 | #208 | Fair $45,600 |
| Immigrants | Thailand | 23.7 /100 | #209 | Fair $45,598 |
| Immigrants | Grenada | 23.6 /100 | #210 | Fair $45,596 |
| Panamanians | 23.5 /100 | #211 | Fair $45,593 |
| Bermudans | 23.5 /100 | #212 | Fair $45,593 |
Demographics Similar to Immigrants from Eastern Asia by Median Earnings
In terms of median earnings, the demographic groups most similar to Immigrants from Eastern Asia are Indian (Asian) ($56,253, a difference of 0.12%), Immigrants from Australia ($56,305, a difference of 0.22%), Immigrants from China ($56,638, a difference of 0.81%), Immigrants from Ireland ($56,854, a difference of 1.2%), and Immigrants from Israel ($57,034, a difference of 1.5%).
| Demographics | Rating | Rank | Median Earnings |
| Okinawans | 100.0 /100 | #9 | Exceptional $57,550 |
| Immigrants | South Central Asia | 100.0 /100 | #10 | Exceptional $57,114 |
| Immigrants | Israel | 100.0 /100 | #11 | Exceptional $57,034 |
| Immigrants | Ireland | 100.0 /100 | #12 | Exceptional $56,854 |
| Immigrants | China | 100.0 /100 | #13 | Exceptional $56,638 |
| Immigrants | Australia | 100.0 /100 | #14 | Exceptional $56,305 |
| Indians (Asian) | 100.0 /100 | #15 | Exceptional $56,253 |
| Immigrants | Eastern Asia | 100.0 /100 | #16 | Exceptional $56,183 |
| Eastern Europeans | 100.0 /100 | #17 | Exceptional $55,084 |
| Immigrants | Japan | 100.0 /100 | #18 | Exceptional $54,938 |
| Immigrants | Belgium | 100.0 /100 | #19 | Exceptional $54,679 |
| Cypriots | 100.0 /100 | #20 | Exceptional $54,589 |
| Burmese | 100.0 /100 | #21 | Exceptional $54,559 |
| Immigrants | Korea | 100.0 /100 | #22 | Exceptional $54,530 |
| Immigrants | Sweden | 100.0 /100 | #23 | Exceptional $54,478 |