Immigrants from Austria vs Salvadoran Median Male Earnings
COMPARE
Immigrants from Austria
Salvadoran
Median Male Earnings
Median Male Earnings Comparison
Immigrants from Austria
Salvadorans
$62,164
MEDIAN MALE EARNINGS
99.9/ 100
METRIC RATING
47th/ 347
METRIC RANK
$48,646
MEDIAN MALE EARNINGS
0.3/ 100
METRIC RATING
272nd/ 347
METRIC RANK
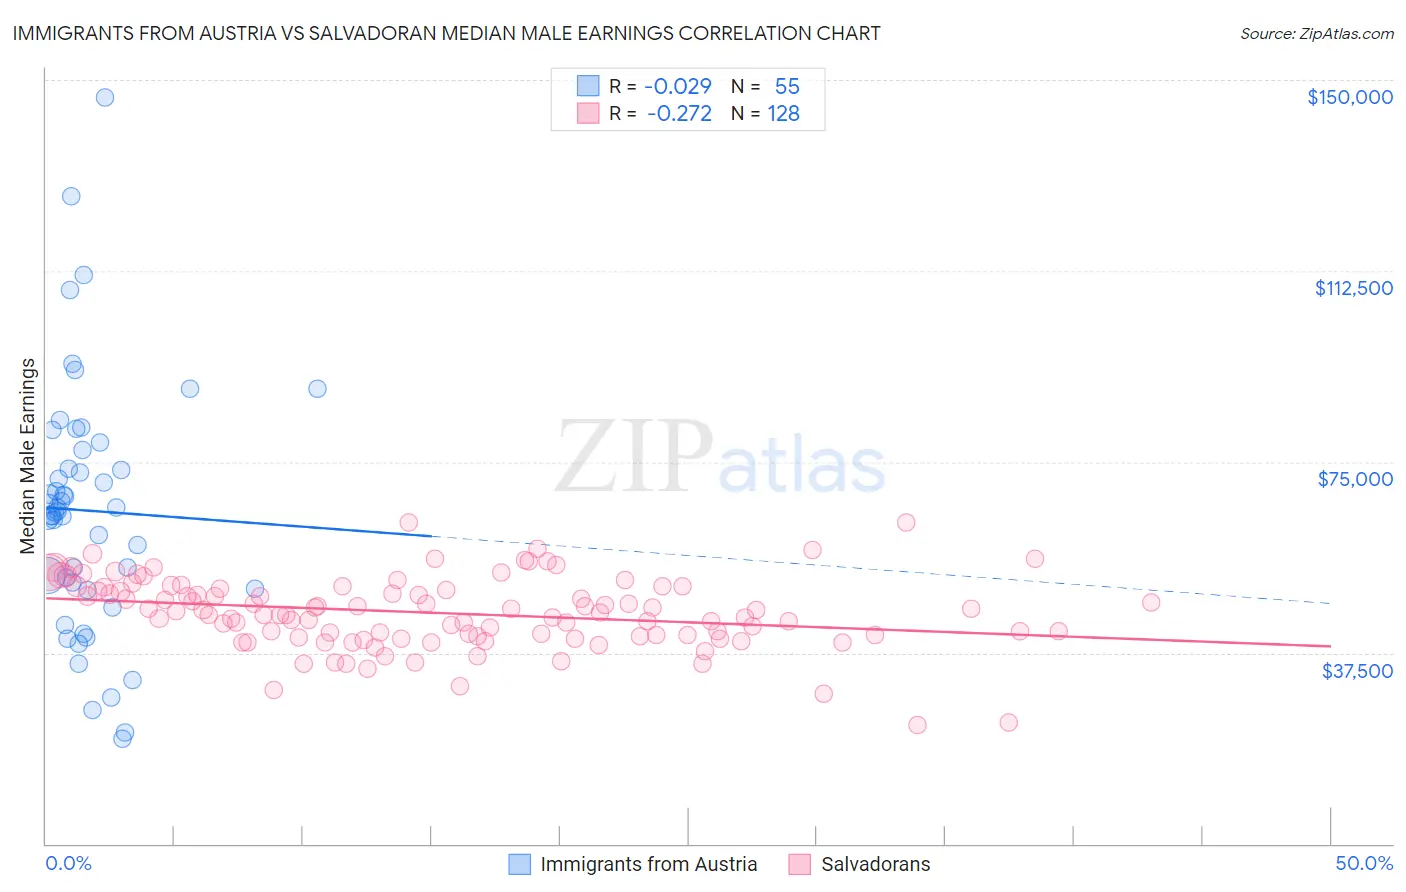
Immigrants from Austria vs Salvadoran Median Male Earnings Correlation Chart
The statistical analysis conducted on geographies consisting of 167,941,701 people shows no correlation between the proportion of Immigrants from Austria and median male earnings in the United States with a correlation coefficient (R) of -0.029 and weighted average of $62,164. Similarly, the statistical analysis conducted on geographies consisting of 398,918,079 people shows a weak negative correlation between the proportion of Salvadorans and median male earnings in the United States with a correlation coefficient (R) of -0.272 and weighted average of $48,646, a difference of 27.8%.
Median Male Earnings Correlation Summary
| Measurement | Immigrants from Austria | Salvadoran |
| Minimum | $20,568 | $23,439 |
| Maximum | $146,444 | $63,214 |
| Range | $125,876 | $39,775 |
| Mean | $65,411 | $45,362 |
| Median | $65,258 | $45,515 |
| Interquartile 25% (IQ1) | $50,000 | $40,883 |
| Interquartile 75% (IQ3) | $77,315 | $50,182 |
| Interquartile Range (IQR) | $27,315 | $9,299 |
| Standard Deviation (Sample) | $24,493 | $7,004 |
| Standard Deviation (Population) | $24,269 | $6,977 |
Similar Demographics by Median Male Earnings
Demographics Similar to Immigrants from Austria by Median Male Earnings
In terms of median male earnings, the demographic groups most similar to Immigrants from Austria are Immigrants from Malaysia ($62,121, a difference of 0.070%), Immigrants from Czechoslovakia ($62,217, a difference of 0.090%), Immigrants from Europe ($62,057, a difference of 0.17%), Bulgarian ($62,378, a difference of 0.35%), and Cambodian ($62,516, a difference of 0.57%).
| Demographics | Rating | Rank | Median Male Earnings |
| Australians | 100.0 /100 | #40 | Exceptional $62,857 |
| Immigrants | Turkey | 100.0 /100 | #41 | Exceptional $62,728 |
| Immigrants | Greece | 100.0 /100 | #42 | Exceptional $62,689 |
| Immigrants | Belarus | 100.0 /100 | #43 | Exceptional $62,658 |
| Cambodians | 100.0 /100 | #44 | Exceptional $62,516 |
| Bulgarians | 100.0 /100 | #45 | Exceptional $62,378 |
| Immigrants | Czechoslovakia | 99.9 /100 | #46 | Exceptional $62,217 |
| Immigrants | Austria | 99.9 /100 | #47 | Exceptional $62,164 |
| Immigrants | Malaysia | 99.9 /100 | #48 | Exceptional $62,121 |
| Immigrants | Europe | 99.9 /100 | #49 | Exceptional $62,057 |
| Bhutanese | 99.9 /100 | #50 | Exceptional $61,759 |
| Estonians | 99.9 /100 | #51 | Exceptional $61,710 |
| Immigrants | Norway | 99.9 /100 | #52 | Exceptional $61,628 |
| South Africans | 99.9 /100 | #53 | Exceptional $61,460 |
| Immigrants | Latvia | 99.9 /100 | #54 | Exceptional $61,422 |
Demographics Similar to Salvadorans by Median Male Earnings
In terms of median male earnings, the demographic groups most similar to Salvadorans are Jamaican ($48,632, a difference of 0.030%), Cherokee ($48,669, a difference of 0.050%), Potawatomi ($48,768, a difference of 0.25%), Colville ($48,516, a difference of 0.27%), and Tsimshian ($48,836, a difference of 0.39%).
| Demographics | Rating | Rank | Median Male Earnings |
| Immigrants | Laos | 0.6 /100 | #265 | Tragic $49,190 |
| Somalis | 0.5 /100 | #266 | Tragic $49,025 |
| Spanish Americans | 0.5 /100 | #267 | Tragic $49,008 |
| Ute | 0.4 /100 | #268 | Tragic $48,899 |
| Tsimshian | 0.4 /100 | #269 | Tragic $48,836 |
| Potawatomi | 0.4 /100 | #270 | Tragic $48,768 |
| Cherokee | 0.3 /100 | #271 | Tragic $48,669 |
| Salvadorans | 0.3 /100 | #272 | Tragic $48,646 |
| Jamaicans | 0.3 /100 | #273 | Tragic $48,632 |
| Colville | 0.3 /100 | #274 | Tragic $48,516 |
| Immigrants | Somalia | 0.3 /100 | #275 | Tragic $48,439 |
| Blackfeet | 0.3 /100 | #276 | Tragic $48,402 |
| Belizeans | 0.2 /100 | #277 | Tragic $48,358 |
| Immigrants | Liberia | 0.2 /100 | #278 | Tragic $48,317 |
| Hmong | 0.2 /100 | #279 | Tragic $48,254 |