Tlingit-Haida vs Immigrants from Malaysia Householder Income Ages 25 - 44 years
COMPARE
Tlingit-Haida
Immigrants from Malaysia
Householder Income Ages 25 - 44 years
Householder Income Ages 25 - 44 years Comparison
Tlingit-Haida
Immigrants from Malaysia
$92,987
HOUSEHOLDER INCOME AGES 25 - 44 YEARS
29.4/ 100
METRIC RATING
191st/ 347
METRIC RANK
$107,650
HOUSEHOLDER INCOME AGES 25 - 44 YEARS
99.9/ 100
METRIC RATING
43rd/ 347
METRIC RANK
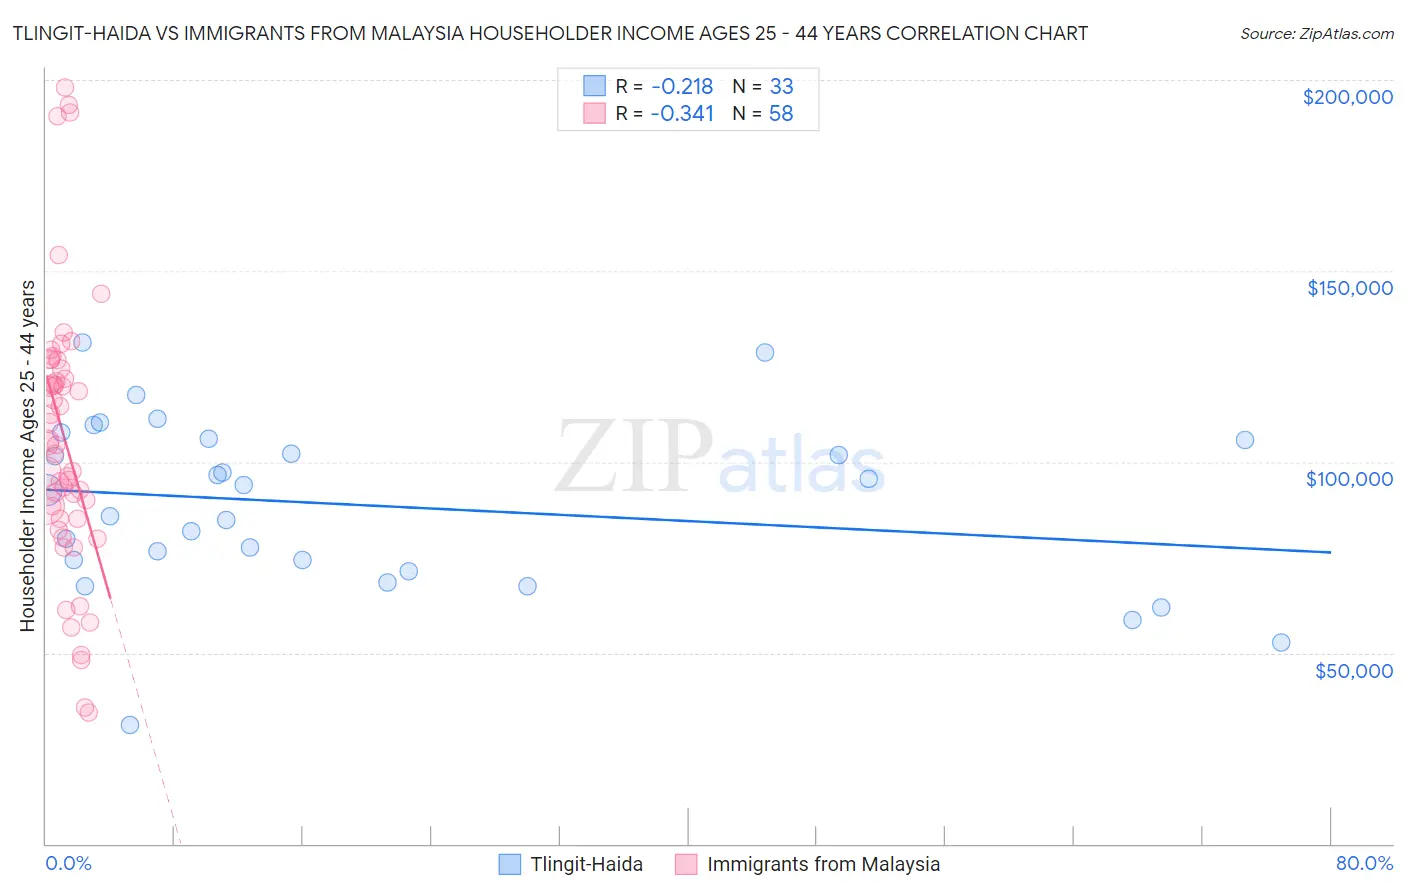
Tlingit-Haida vs Immigrants from Malaysia Householder Income Ages 25 - 44 years Correlation Chart
The statistical analysis conducted on geographies consisting of 60,815,061 people shows a weak negative correlation between the proportion of Tlingit-Haida and household income with householder between the ages 25 and 44 in the United States with a correlation coefficient (R) of -0.218 and weighted average of $92,987. Similarly, the statistical analysis conducted on geographies consisting of 197,845,248 people shows a mild negative correlation between the proportion of Immigrants from Malaysia and household income with householder between the ages 25 and 44 in the United States with a correlation coefficient (R) of -0.341 and weighted average of $107,650, a difference of 15.8%.
Householder Income Ages 25 - 44 years Correlation Summary
| Measurement | Tlingit-Haida | Immigrants from Malaysia |
| Minimum | $30,938 | $34,268 |
| Maximum | $131,395 | $197,953 |
| Range | $100,457 | $163,685 |
| Mean | $88,610 | $106,093 |
| Median | $92,732 | $104,675 |
| Interquartile 25% (IQ1) | $72,697 | $85,164 |
| Interquartile 75% (IQ3) | $105,957 | $124,430 |
| Interquartile Range (IQR) | $33,260 | $39,265 |
| Standard Deviation (Sample) | $22,410 | $35,722 |
| Standard Deviation (Population) | $22,068 | $35,413 |
Similar Demographics by Householder Income Ages 25 - 44 years
Demographics Similar to Tlingit-Haida by Householder Income Ages 25 - 44 years
In terms of householder income ages 25 - 44 years, the demographic groups most similar to Tlingit-Haida are Welsh ($93,039, a difference of 0.060%), Dutch ($93,081, a difference of 0.10%), Immigrants from Costa Rica ($92,876, a difference of 0.12%), Immigrants from Sierra Leone ($93,115, a difference of 0.14%), and Spaniard ($93,366, a difference of 0.41%).
| Demographics | Rating | Rank | Householder Income Ages 25 - 44 years |
| Germans | 36.0 /100 | #184 | Fair $93,531 |
| Immigrants | Eritrea | 35.2 /100 | #185 | Fair $93,466 |
| Sierra Leoneans | 34.8 /100 | #186 | Fair $93,435 |
| Spaniards | 34.0 /100 | #187 | Fair $93,366 |
| Immigrants | Sierra Leone | 30.9 /100 | #188 | Fair $93,115 |
| Dutch | 30.5 /100 | #189 | Fair $93,081 |
| Welsh | 30.0 /100 | #190 | Fair $93,039 |
| Tlingit-Haida | 29.4 /100 | #191 | Fair $92,987 |
| Immigrants | Costa Rica | 28.2 /100 | #192 | Fair $92,876 |
| Samoans | 23.0 /100 | #193 | Fair $92,385 |
| Immigrants | Azores | 22.4 /100 | #194 | Fair $92,322 |
| Celtics | 21.6 /100 | #195 | Fair $92,241 |
| Immigrants | Colombia | 21.3 /100 | #196 | Fair $92,204 |
| Spanish | 21.2 /100 | #197 | Fair $92,200 |
| Vietnamese | 20.2 /100 | #198 | Fair $92,089 |
Demographics Similar to Immigrants from Malaysia by Householder Income Ages 25 - 44 years
In terms of householder income ages 25 - 44 years, the demographic groups most similar to Immigrants from Malaysia are Immigrants from Indonesia ($107,627, a difference of 0.020%), Israeli ($107,579, a difference of 0.070%), Australian ($107,912, a difference of 0.24%), Immigrants from Belarus ($107,393, a difference of 0.24%), and Estonian ($107,269, a difference of 0.36%).
| Demographics | Rating | Rank | Householder Income Ages 25 - 44 years |
| Latvians | 100.0 /100 | #36 | Exceptional $108,926 |
| Immigrants | Russia | 100.0 /100 | #37 | Exceptional $108,751 |
| Soviet Union | 100.0 /100 | #38 | Exceptional $108,457 |
| Immigrants | France | 99.9 /100 | #39 | Exceptional $108,257 |
| Immigrants | Lithuania | 99.9 /100 | #40 | Exceptional $108,149 |
| Immigrants | Bolivia | 99.9 /100 | #41 | Exceptional $108,128 |
| Australians | 99.9 /100 | #42 | Exceptional $107,912 |
| Immigrants | Malaysia | 99.9 /100 | #43 | Exceptional $107,650 |
| Immigrants | Indonesia | 99.9 /100 | #44 | Exceptional $107,627 |
| Israelis | 99.9 /100 | #45 | Exceptional $107,579 |
| Immigrants | Belarus | 99.9 /100 | #46 | Exceptional $107,393 |
| Estonians | 99.9 /100 | #47 | Exceptional $107,269 |
| Bulgarians | 99.9 /100 | #48 | Exceptional $107,264 |
| Immigrants | Turkey | 99.9 /100 | #49 | Exceptional $107,258 |
| Cambodians | 99.9 /100 | #50 | Exceptional $107,148 |