Thai vs Immigrants from Dominica Householder Income Ages 25 - 44 years
COMPARE
Thai
Immigrants from Dominica
Householder Income Ages 25 - 44 years
Householder Income Ages 25 - 44 years Comparison
Thais
Immigrants from Dominica
$121,778
HOUSEHOLDER INCOME AGES 25 - 44 YEARS
100.0/ 100
METRIC RATING
6th/ 347
METRIC RANK
$81,351
HOUSEHOLDER INCOME AGES 25 - 44 YEARS
0.1/ 100
METRIC RATING
296th/ 347
METRIC RANK
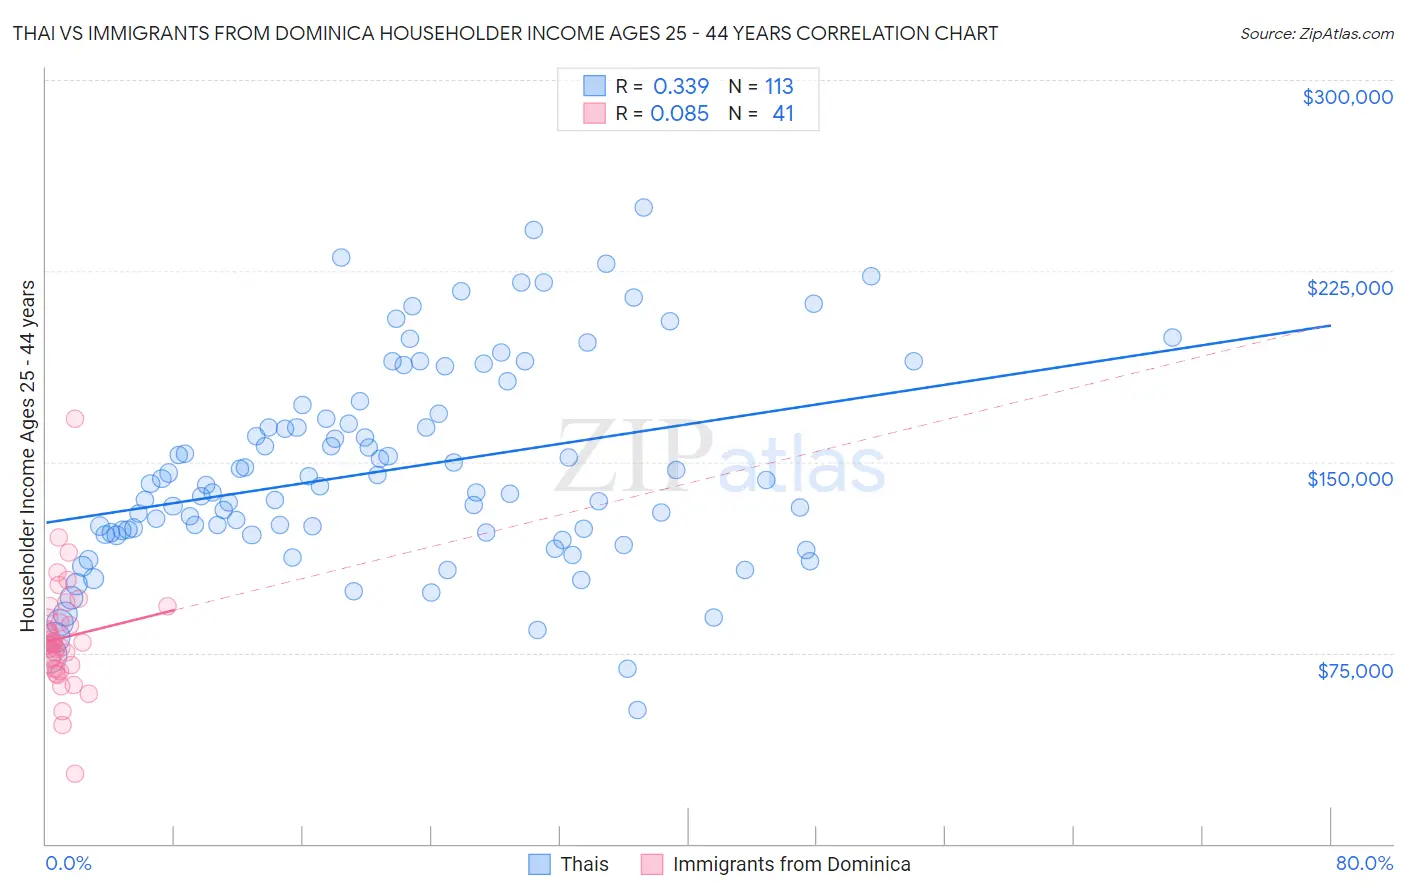
Thai vs Immigrants from Dominica Householder Income Ages 25 - 44 years Correlation Chart
The statistical analysis conducted on geographies consisting of 474,108,438 people shows a mild positive correlation between the proportion of Thais and household income with householder between the ages 25 and 44 in the United States with a correlation coefficient (R) of 0.339 and weighted average of $121,778. Similarly, the statistical analysis conducted on geographies consisting of 83,772,470 people shows a slight positive correlation between the proportion of Immigrants from Dominica and household income with householder between the ages 25 and 44 in the United States with a correlation coefficient (R) of 0.085 and weighted average of $81,351, a difference of 49.7%.
Householder Income Ages 25 - 44 years Correlation Summary
| Measurement | Thai | Immigrants from Dominica |
| Minimum | $52,604 | $27,269 |
| Maximum | $250,001 | $167,054 |
| Range | $197,397 | $139,785 |
| Mean | $146,679 | $80,956 |
| Median | $140,455 | $78,585 |
| Interquartile 25% (IQ1) | $121,721 | $68,699 |
| Interquartile 75% (IQ3) | $167,903 | $90,712 |
| Interquartile Range (IQR) | $46,181 | $22,013 |
| Standard Deviation (Sample) | $39,916 | $22,322 |
| Standard Deviation (Population) | $39,739 | $22,048 |
Similar Demographics by Householder Income Ages 25 - 44 years
Demographics Similar to Thais by Householder Income Ages 25 - 44 years
In terms of householder income ages 25 - 44 years, the demographic groups most similar to Thais are Immigrants from Ireland ($120,333, a difference of 1.2%), Iranian ($120,292, a difference of 1.2%), Immigrants from China ($119,756, a difference of 1.7%), Indian (Asian) ($119,496, a difference of 1.9%), and Immigrants from India ($124,238, a difference of 2.0%).
| Demographics | Rating | Rank | Householder Income Ages 25 - 44 years |
| Immigrants | Taiwan | 100.0 /100 | #1 | Exceptional $129,122 |
| Filipinos | 100.0 /100 | #2 | Exceptional $128,723 |
| Immigrants | Hong Kong | 100.0 /100 | #3 | Exceptional $128,140 |
| Immigrants | Singapore | 100.0 /100 | #4 | Exceptional $124,429 |
| Immigrants | India | 100.0 /100 | #5 | Exceptional $124,238 |
| Thais | 100.0 /100 | #6 | Exceptional $121,778 |
| Immigrants | Ireland | 100.0 /100 | #7 | Exceptional $120,333 |
| Iranians | 100.0 /100 | #8 | Exceptional $120,292 |
| Immigrants | China | 100.0 /100 | #9 | Exceptional $119,756 |
| Indians (Asian) | 100.0 /100 | #10 | Exceptional $119,496 |
| Okinawans | 100.0 /100 | #11 | Exceptional $119,349 |
| Immigrants | Iran | 100.0 /100 | #12 | Exceptional $119,204 |
| Immigrants | Eastern Asia | 100.0 /100 | #13 | Exceptional $118,056 |
| Immigrants | Israel | 100.0 /100 | #14 | Exceptional $117,219 |
| Immigrants | South Central Asia | 100.0 /100 | #15 | Exceptional $116,626 |
Demographics Similar to Immigrants from Dominica by Householder Income Ages 25 - 44 years
In terms of householder income ages 25 - 44 years, the demographic groups most similar to Immigrants from Dominica are Immigrants from Guatemala ($81,341, a difference of 0.010%), Bangladeshi ($81,363, a difference of 0.020%), Dominican ($81,229, a difference of 0.15%), Cuban ($81,483, a difference of 0.16%), and Blackfeet ($81,531, a difference of 0.22%).
| Demographics | Rating | Rank | Householder Income Ages 25 - 44 years |
| Shoshone | 0.1 /100 | #289 | Tragic $82,062 |
| Liberians | 0.1 /100 | #290 | Tragic $82,005 |
| Potawatomi | 0.1 /100 | #291 | Tragic $81,774 |
| Yaqui | 0.1 /100 | #292 | Tragic $81,656 |
| Blackfeet | 0.1 /100 | #293 | Tragic $81,531 |
| Cubans | 0.1 /100 | #294 | Tragic $81,483 |
| Bangladeshis | 0.1 /100 | #295 | Tragic $81,363 |
| Immigrants | Dominica | 0.1 /100 | #296 | Tragic $81,351 |
| Immigrants | Guatemala | 0.1 /100 | #297 | Tragic $81,341 |
| Dominicans | 0.1 /100 | #298 | Tragic $81,229 |
| Immigrants | Liberia | 0.1 /100 | #299 | Tragic $80,863 |
| Cherokee | 0.0 /100 | #300 | Tragic $80,843 |
| Immigrants | Micronesia | 0.0 /100 | #301 | Tragic $80,544 |
| Hispanics or Latinos | 0.0 /100 | #302 | Tragic $80,515 |
| Mexicans | 0.0 /100 | #303 | Tragic $80,427 |