Thai vs Ethiopian Median Earnings
COMPARE
Thai
Ethiopian
Median Earnings
Median Earnings Comparison
Thais
Ethiopians
$59,237
MEDIAN EARNINGS
100.0/ 100
METRIC RATING
5th/ 347
METRIC RANK
$49,572
MEDIAN EARNINGS
98.8/ 100
METRIC RATING
102nd/ 347
METRIC RANK
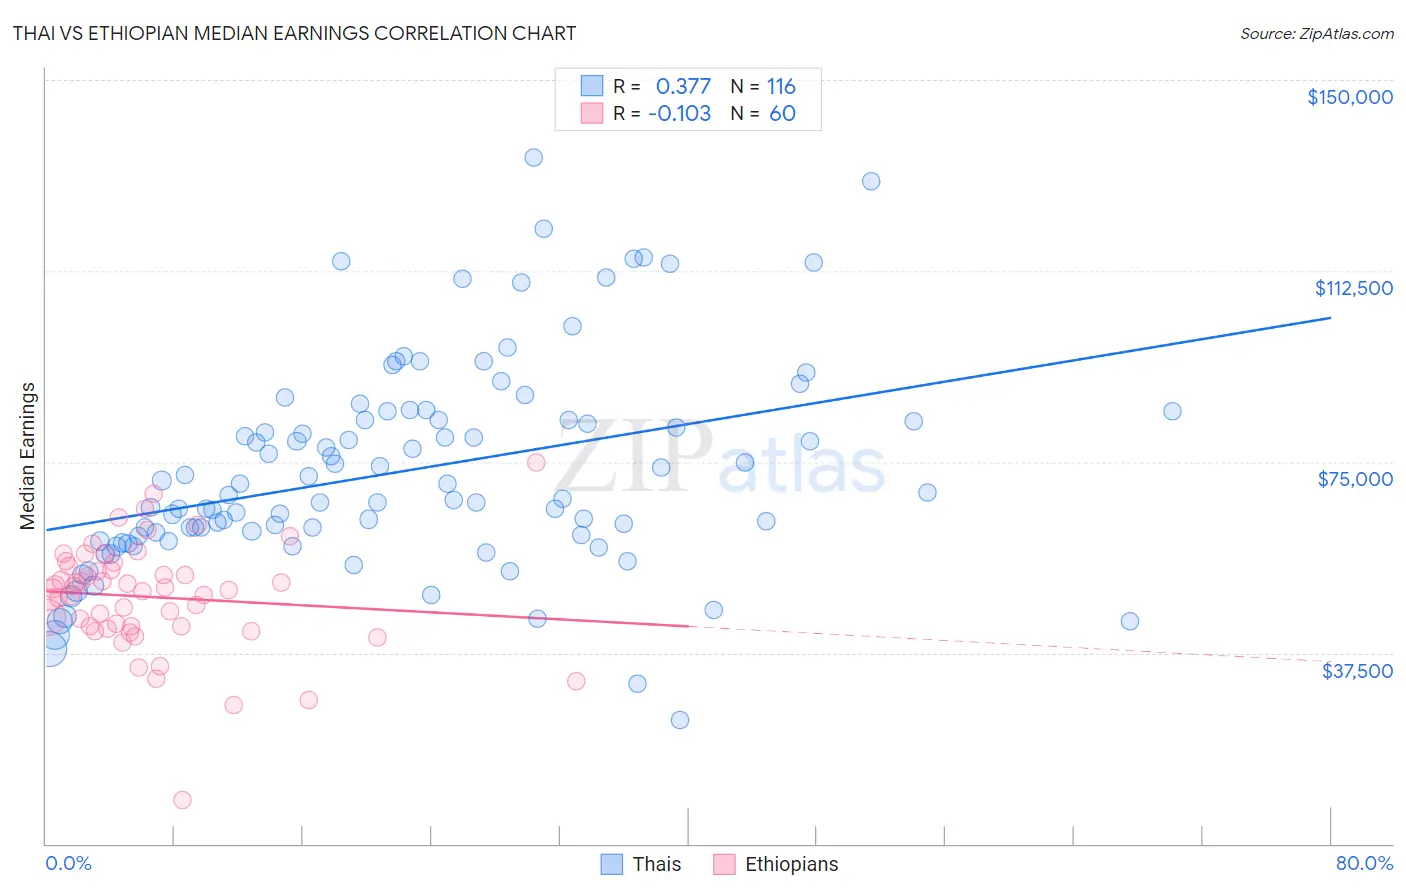
Thai vs Ethiopian Median Earnings Correlation Chart
The statistical analysis conducted on geographies consisting of 475,851,474 people shows a mild positive correlation between the proportion of Thais and median earnings in the United States with a correlation coefficient (R) of 0.377 and weighted average of $59,237. Similarly, the statistical analysis conducted on geographies consisting of 223,260,849 people shows a poor negative correlation between the proportion of Ethiopians and median earnings in the United States with a correlation coefficient (R) of -0.103 and weighted average of $49,572, a difference of 19.5%.
Median Earnings Correlation Summary
| Measurement | Thai | Ethiopian |
| Minimum | $24,353 | $8,623 |
| Maximum | $134,793 | $74,844 |
| Range | $110,440 | $66,221 |
| Mean | $73,089 | $48,479 |
| Median | $68,147 | $49,984 |
| Interquartile 25% (IQ1) | $59,963 | $42,620 |
| Interquartile 75% (IQ3) | $83,196 | $54,089 |
| Interquartile Range (IQR) | $23,232 | $11,470 |
| Standard Deviation (Sample) | $20,568 | $10,733 |
| Standard Deviation (Population) | $20,479 | $10,643 |
Similar Demographics by Median Earnings
Demographics Similar to Thais by Median Earnings
In terms of median earnings, the demographic groups most similar to Thais are Immigrants from Hong Kong ($59,433, a difference of 0.33%), Immigrants from Singapore ($59,038, a difference of 0.34%), Iranian ($58,474, a difference of 1.3%), Immigrants from India ($60,648, a difference of 2.4%), and Immigrants from Iran ($57,612, a difference of 2.8%).
| Demographics | Rating | Rank | Median Earnings |
| Filipinos | 100.0 /100 | #1 | Exceptional $61,197 |
| Immigrants | Taiwan | 100.0 /100 | #2 | Exceptional $61,151 |
| Immigrants | India | 100.0 /100 | #3 | Exceptional $60,648 |
| Immigrants | Hong Kong | 100.0 /100 | #4 | Exceptional $59,433 |
| Thais | 100.0 /100 | #5 | Exceptional $59,237 |
| Immigrants | Singapore | 100.0 /100 | #6 | Exceptional $59,038 |
| Iranians | 100.0 /100 | #7 | Exceptional $58,474 |
| Immigrants | Iran | 100.0 /100 | #8 | Exceptional $57,612 |
| Okinawans | 100.0 /100 | #9 | Exceptional $57,550 |
| Immigrants | South Central Asia | 100.0 /100 | #10 | Exceptional $57,114 |
| Immigrants | Israel | 100.0 /100 | #11 | Exceptional $57,034 |
| Immigrants | Ireland | 100.0 /100 | #12 | Exceptional $56,854 |
| Immigrants | China | 100.0 /100 | #13 | Exceptional $56,638 |
| Immigrants | Australia | 100.0 /100 | #14 | Exceptional $56,305 |
| Indians (Asian) | 100.0 /100 | #15 | Exceptional $56,253 |
Demographics Similar to Ethiopians by Median Earnings
In terms of median earnings, the demographic groups most similar to Ethiopians are Immigrants from Poland ($49,633, a difference of 0.12%), Jordanian ($49,632, a difference of 0.12%), Austrian ($49,501, a difference of 0.14%), Immigrants from Northern Africa ($49,648, a difference of 0.15%), and Immigrants from Afghanistan ($49,645, a difference of 0.15%).
| Demographics | Rating | Rank | Median Earnings |
| Immigrants | England | 99.0 /100 | #95 | Exceptional $49,722 |
| Immigrants | Lebanon | 99.0 /100 | #96 | Exceptional $49,682 |
| Immigrants | North Macedonia | 98.9 /100 | #97 | Exceptional $49,658 |
| Immigrants | Northern Africa | 98.9 /100 | #98 | Exceptional $49,648 |
| Immigrants | Afghanistan | 98.9 /100 | #99 | Exceptional $49,645 |
| Immigrants | Poland | 98.9 /100 | #100 | Exceptional $49,633 |
| Jordanians | 98.9 /100 | #101 | Exceptional $49,632 |
| Ethiopians | 98.8 /100 | #102 | Exceptional $49,572 |
| Austrians | 98.7 /100 | #103 | Exceptional $49,501 |
| Immigrants | Brazil | 98.6 /100 | #104 | Exceptional $49,463 |
| Immigrants | Western Asia | 98.4 /100 | #105 | Exceptional $49,389 |
| Immigrants | Albania | 98.4 /100 | #106 | Exceptional $49,377 |
| Immigrants | Morocco | 98.4 /100 | #107 | Exceptional $49,368 |
| Palestinians | 98.0 /100 | #108 | Exceptional $49,209 |
| Syrians | 97.1 /100 | #109 | Exceptional $48,934 |