Thai vs Czechoslovakian Householder Income Under 25 years
COMPARE
Thai
Czechoslovakian
Householder Income Under 25 years
Householder Income Under 25 years Comparison
Thais
Czechoslovakians
$59,187
HOUSEHOLDER INCOME UNDER 25 YEARS
100.0/ 100
METRIC RATING
6th/ 347
METRIC RANK
$51,224
HOUSEHOLDER INCOME UNDER 25 YEARS
8.6/ 100
METRIC RATING
217th/ 347
METRIC RANK
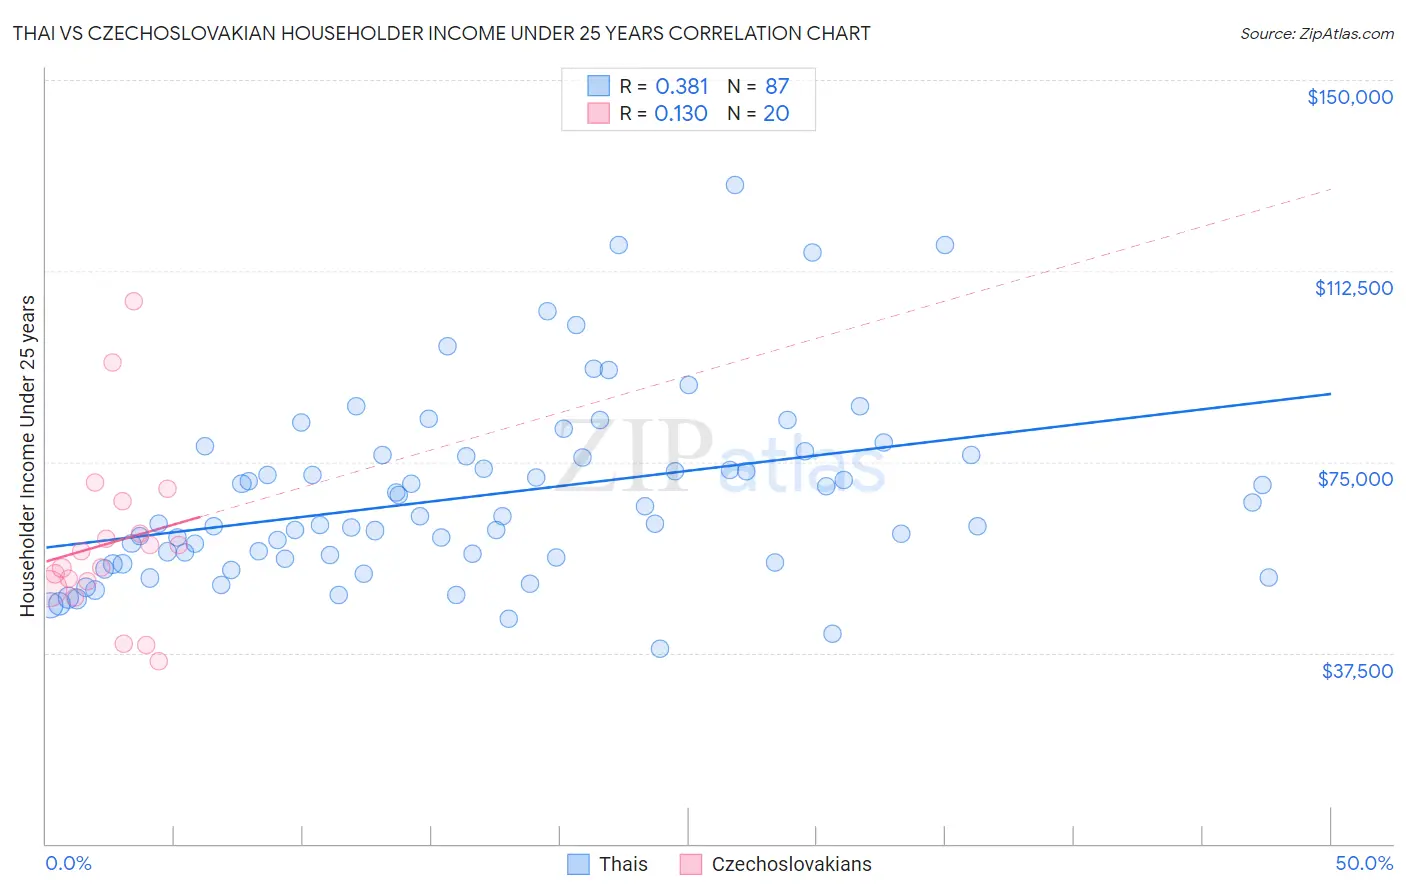
Thai vs Czechoslovakian Householder Income Under 25 years Correlation Chart
The statistical analysis conducted on geographies consisting of 390,520,827 people shows a mild positive correlation between the proportion of Thais and household income with householder under the age of 25 in the United States with a correlation coefficient (R) of 0.381 and weighted average of $59,187. Similarly, the statistical analysis conducted on geographies consisting of 311,218,514 people shows a poor positive correlation between the proportion of Czechoslovakians and household income with householder under the age of 25 in the United States with a correlation coefficient (R) of 0.130 and weighted average of $51,224, a difference of 15.5%.
Householder Income Under 25 years Correlation Summary
| Measurement | Thai | Czechoslovakian |
| Minimum | $38,359 | $35,781 |
| Maximum | $129,301 | $106,448 |
| Range | $90,942 | $70,667 |
| Mean | $68,286 | $59,100 |
| Median | $62,959 | $55,865 |
| Interquartile 25% (IQ1) | $56,029 | $50,876 |
| Interquartile 75% (IQ3) | $76,245 | $64,106 |
| Interquartile Range (IQR) | $20,216 | $13,231 |
| Standard Deviation (Sample) | $17,960 | $17,072 |
| Standard Deviation (Population) | $17,857 | $16,639 |
Similar Demographics by Householder Income Under 25 years
Demographics Similar to Thais by Householder Income Under 25 years
In terms of householder income under 25 years, the demographic groups most similar to Thais are Immigrants from Bolivia ($59,389, a difference of 0.34%), Immigrants from Taiwan ($59,424, a difference of 0.40%), Bolivian ($58,506, a difference of 1.2%), Immigrants from India ($59,914, a difference of 1.2%), and Indian (Asian) ($58,239, a difference of 1.6%).
| Demographics | Rating | Rank | Householder Income Under 25 years |
| Assyrians/Chaldeans/Syriacs | 100.0 /100 | #1 | Exceptional $65,329 |
| Immigrants | Hong Kong | 100.0 /100 | #2 | Exceptional $62,083 |
| Immigrants | India | 100.0 /100 | #3 | Exceptional $59,914 |
| Immigrants | Taiwan | 100.0 /100 | #4 | Exceptional $59,424 |
| Immigrants | Bolivia | 100.0 /100 | #5 | Exceptional $59,389 |
| Thais | 100.0 /100 | #6 | Exceptional $59,187 |
| Bolivians | 100.0 /100 | #7 | Exceptional $58,506 |
| Indians (Asian) | 100.0 /100 | #8 | Exceptional $58,239 |
| Chinese | 100.0 /100 | #9 | Exceptional $58,162 |
| Afghans | 100.0 /100 | #10 | Exceptional $58,019 |
| Immigrants | China | 100.0 /100 | #11 | Exceptional $57,931 |
| Immigrants | Philippines | 100.0 /100 | #12 | Exceptional $57,930 |
| Immigrants | South Central Asia | 100.0 /100 | #13 | Exceptional $57,818 |
| Filipinos | 100.0 /100 | #14 | Exceptional $57,740 |
| Koreans | 100.0 /100 | #15 | Exceptional $57,730 |
Demographics Similar to Czechoslovakians by Householder Income Under 25 years
In terms of householder income under 25 years, the demographic groups most similar to Czechoslovakians are Immigrants from Belize ($51,223, a difference of 0.0%), French ($51,230, a difference of 0.010%), Arab ($51,219, a difference of 0.010%), Icelander ($51,247, a difference of 0.050%), and Zimbabwean ($51,259, a difference of 0.070%).
| Demographics | Rating | Rank | Householder Income Under 25 years |
| Immigrants | Ghana | 10.9 /100 | #210 | Poor $51,333 |
| Irish | 10.6 /100 | #211 | Poor $51,317 |
| Immigrants | Panama | 9.7 /100 | #212 | Tragic $51,278 |
| Dutch | 9.4 /100 | #213 | Tragic $51,265 |
| Zimbabweans | 9.3 /100 | #214 | Tragic $51,259 |
| Icelanders | 9.1 /100 | #215 | Tragic $51,247 |
| French | 8.7 /100 | #216 | Tragic $51,230 |
| Czechoslovakians | 8.6 /100 | #217 | Tragic $51,224 |
| Immigrants | Belize | 8.6 /100 | #218 | Tragic $51,223 |
| Arabs | 8.5 /100 | #219 | Tragic $51,219 |
| Immigrants | Germany | 8.0 /100 | #220 | Tragic $51,190 |
| Immigrants | Eastern Africa | 7.4 /100 | #221 | Tragic $51,158 |
| Spaniards | 6.8 /100 | #222 | Tragic $51,117 |
| Serbians | 6.6 /100 | #223 | Tragic $51,106 |
| Belizeans | 6.4 /100 | #224 | Tragic $51,094 |